Hi everyone,
I am trying to see if an initiative or epic is on-time or not using Gantt.
I want to show that using Gantt chart.
I would like to see two things.
- Show me if an issue target end data has passed issue due date. (showing we are off-track here)
- Show me if target start date has passed ‘today’ and the initiative is not in ‘in progress’ status.
The use case is basically to see if we are on-track to delivery or not using Gantt chart.
Thank you.
Hi, @Arpita_Solanki
I’m sorry for not answering sooner.
Please consider creating a Gantt chart using a Bar chart.
Select your date measures and create a new measure for today using the formula:
DateParse('today')
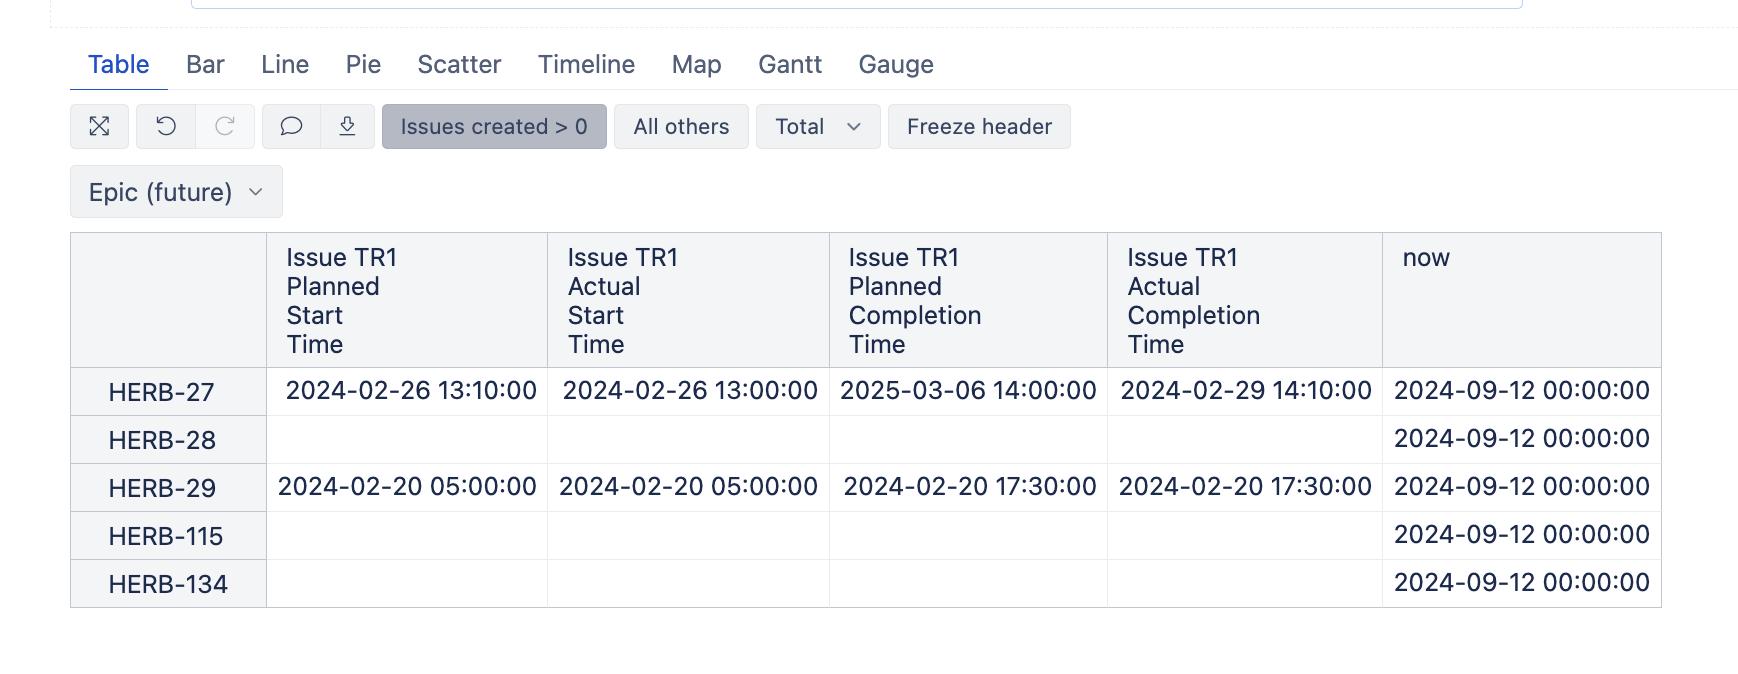
Select “Issues created” and filter rows > 0 for the report context. After filtration criteria are added, delete the measure “Issues created” from columns.
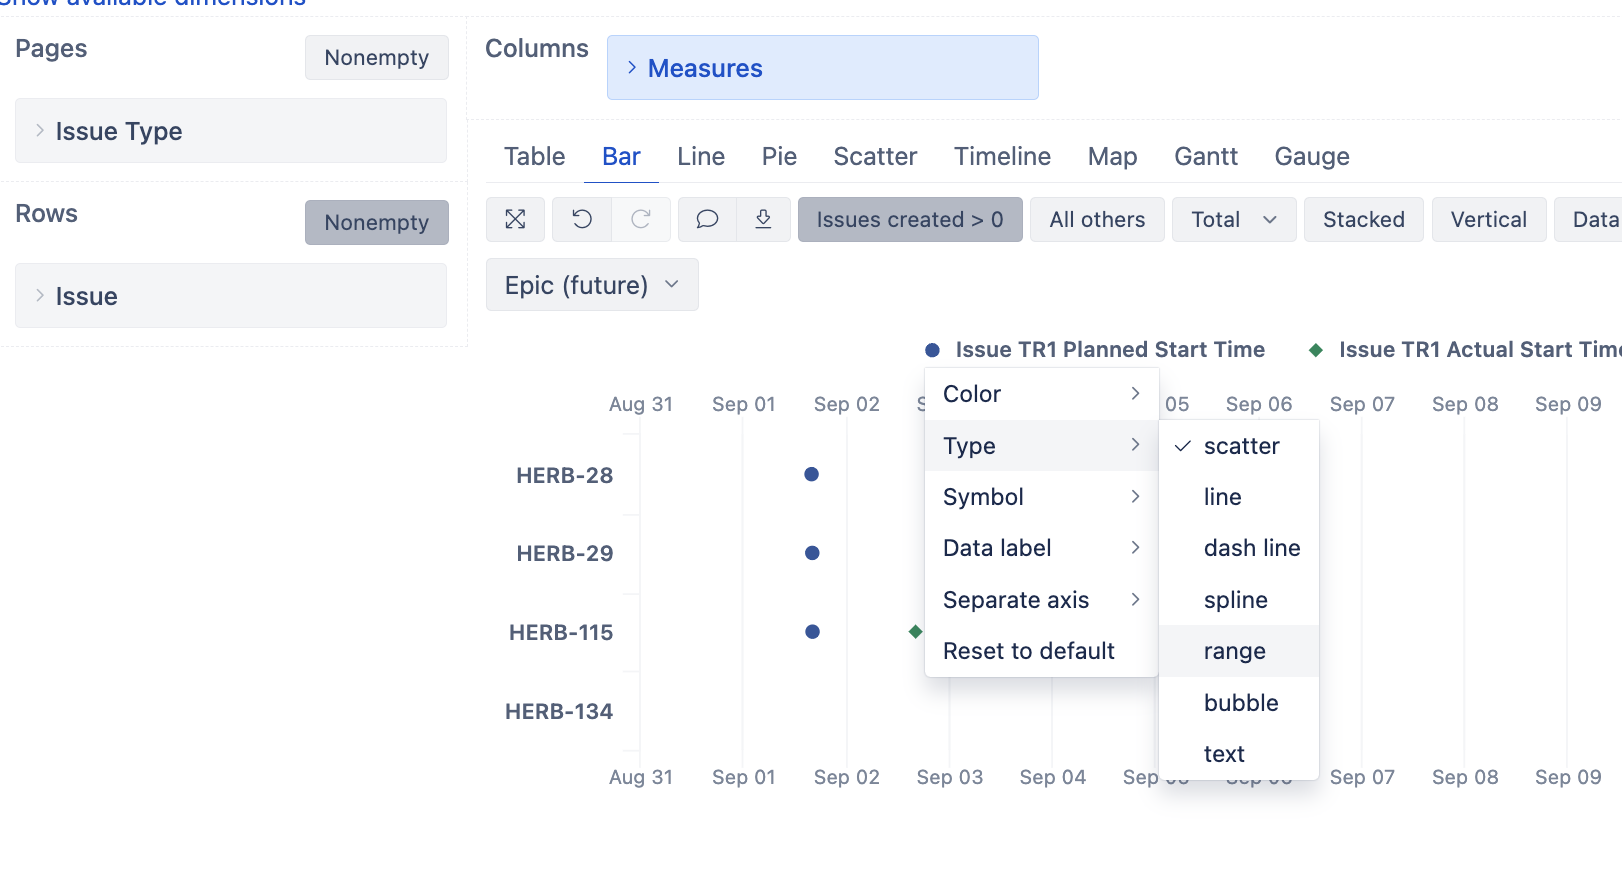
Go to the Bar chart option and select the symbol before the measure. To choose the different Type; for dates, choose “range,” but for “today,” choose a line.
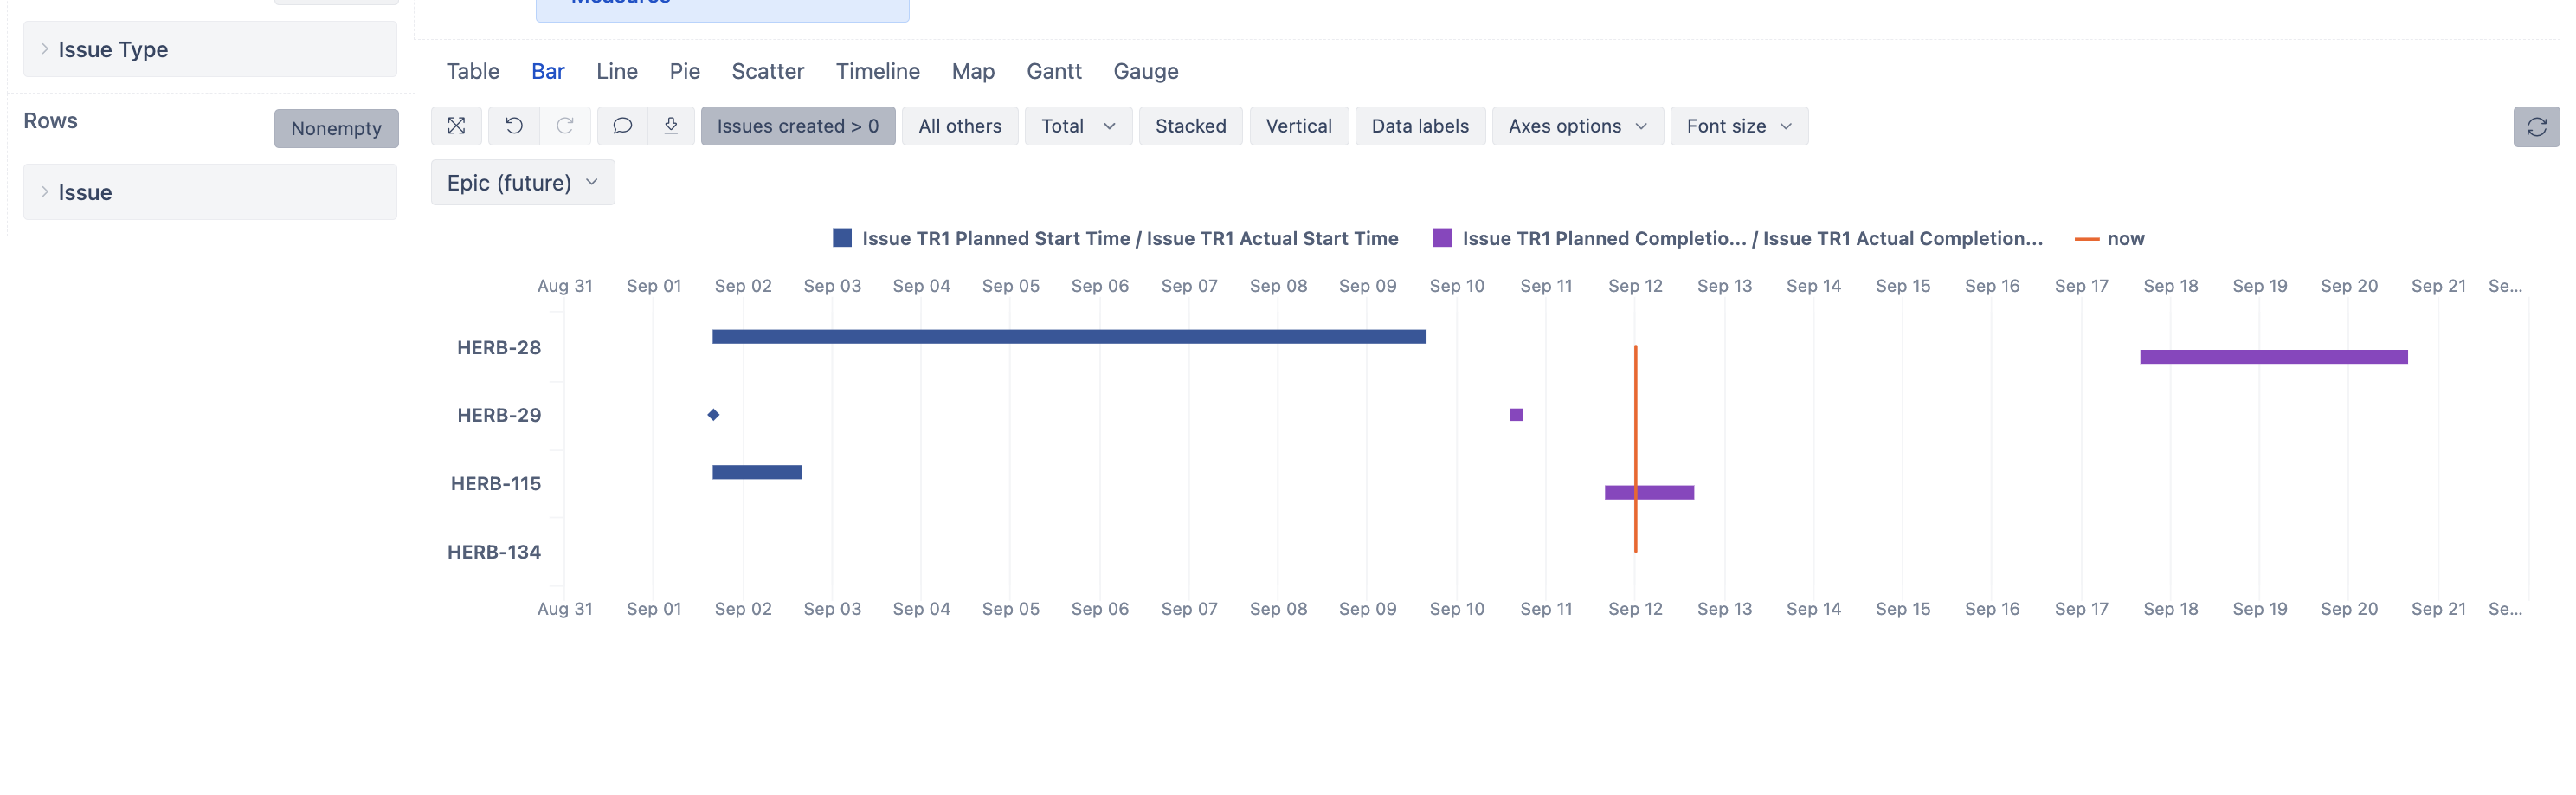
And you will get the Gantt chart, which looks something like this:
Kindly,
Ilze