Hi!
I’m creating a report that shows status transitions throughout the day. I’ve managed to show something like this:
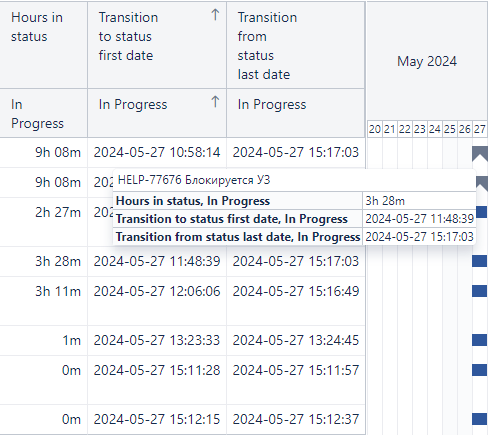
I wonder if I can see in a gantt chart the whole day not the working week with small duration?
Thanks in advance!
Hi!
I’m creating a report that shows status transitions throughout the day. I’ve managed to show something like this:
I wonder if I can see in a gantt chart the whole day not the working week with small duration?
Thanks in advance!
Hello @KAbdulina
Day level is the most granular level of the “Time” dimension in eazyBI.
Unfortunately it won’t be possible to show the status changes in hour-level.
Also, the hourly analysis would mean importing data more often (not just once per day - default import frequency) which could demand more resources to get the most accurate data from Jira into eazyBI.
We do have a feature request in hour backlog to be able to import the Hour dimension into eazyBI and I have added your vote to it, but I cannot promise if/when this could be implemented.
Best wishes,
Elita from support@eazybi.com
Thanks for your response!
Actualy I was thinking the same reason not having hour dimansion.