Apologies if this question has already been addressed in this forum but I could not find the right answer.
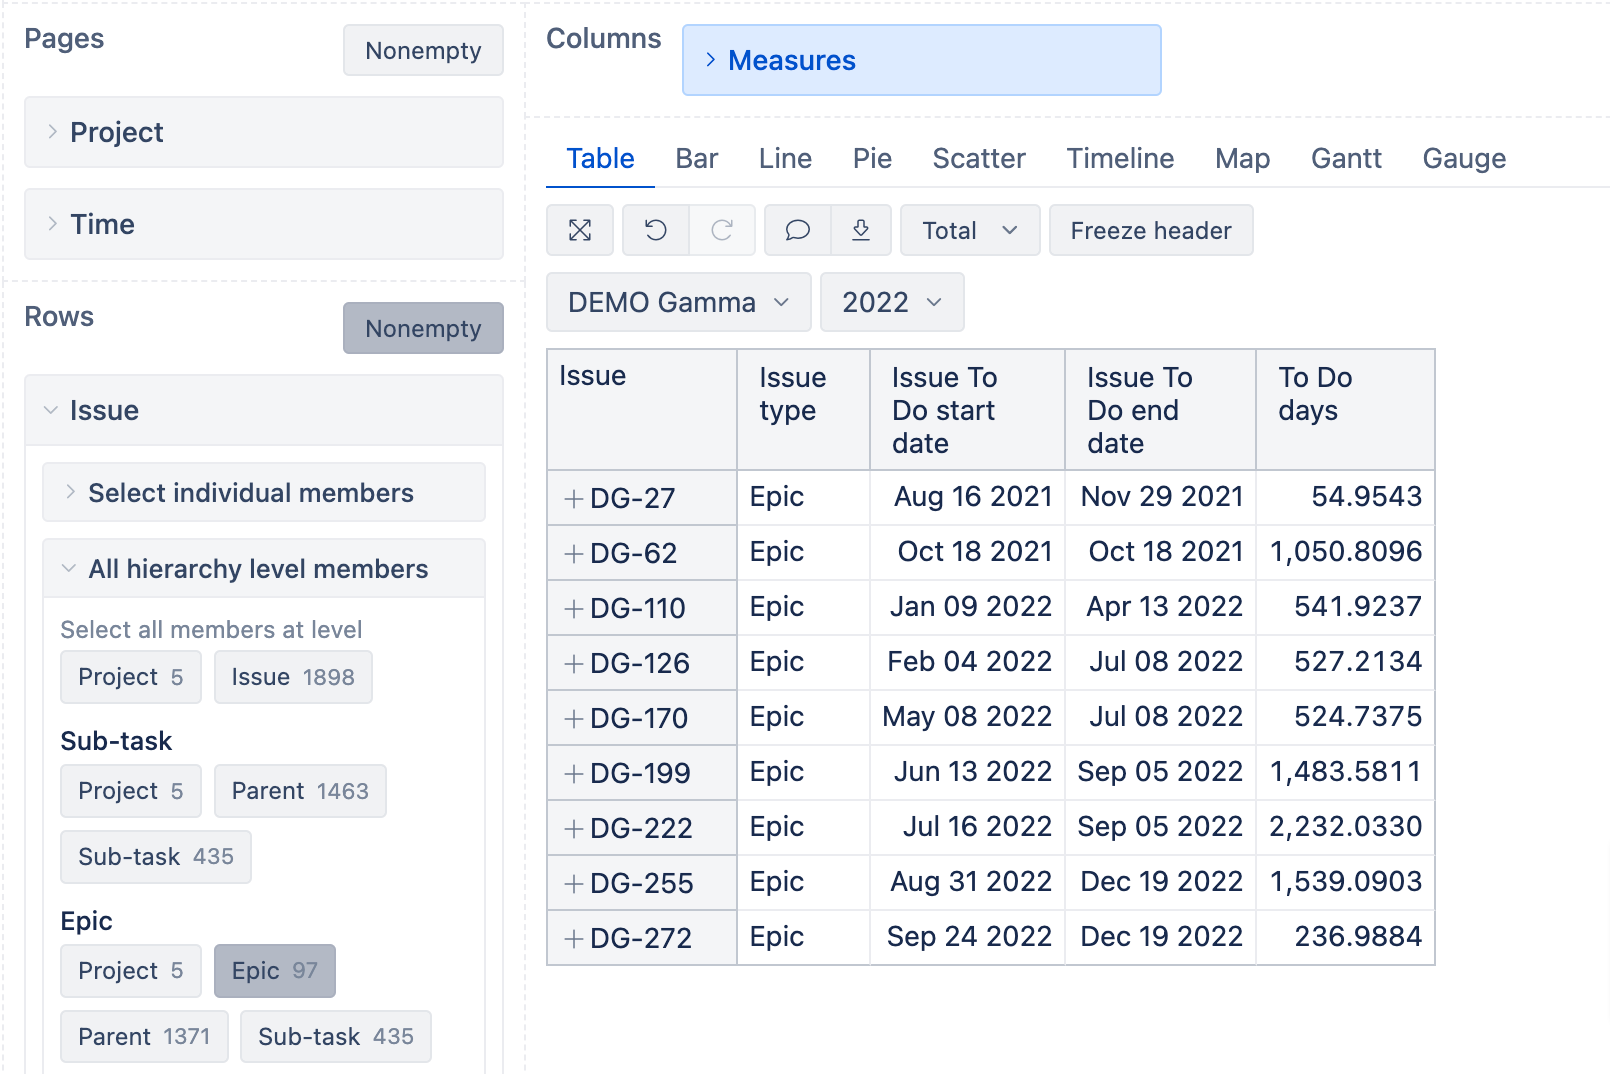
I’m trying to create a gantt chart which shows the time spend of each Issue in an Epic in a specific column of their board.
Let’s make an example with a JIRA board structured with 4 statuses: TO DO | DEVELOPMENT | TESTING | DONE.
I managed to create a nice gantt putting in the columns the measures “Issue Progress start date” and “Issue Progress end date”, but that shows the whole amount of time in all the in progress statuses mapped by JIRA, whereas I need to see the exact DEVELOPMENT status.
Ideally it would be amazing if the gantt could show the time spent in each column of the board, however if this is not possible, being at least able to see one specific column would be a good starting point.
My suggestion is to define & use specific Issue cycles
Based on your description, I would suggest the following steps:
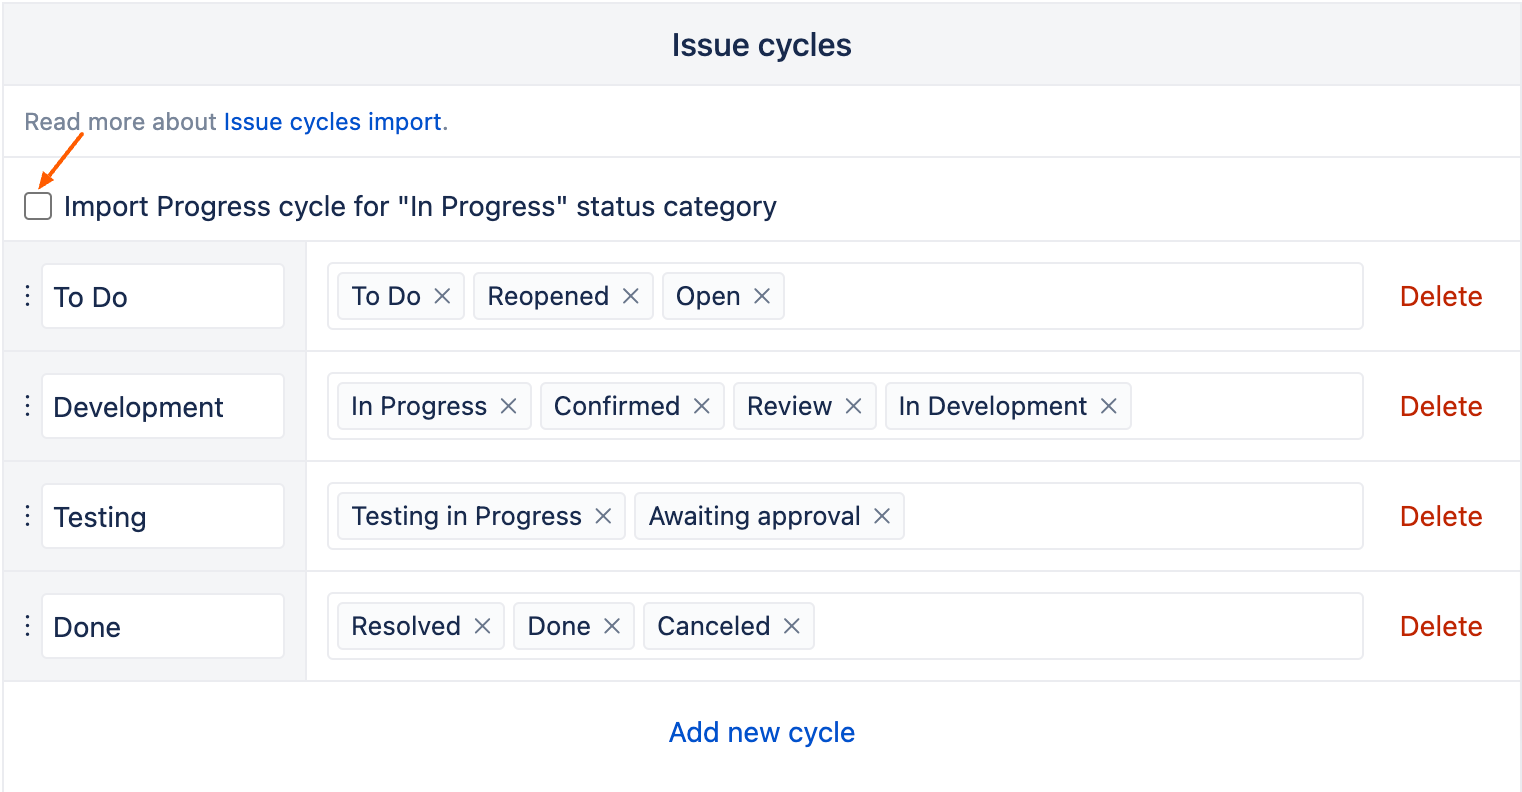
Go to Source Data → Edit → Jira import options General tab → Issue cycles and unselect the “Import Progress cycle for “In Progress” status category” in Jira import options. When this option is selected, eazyBI will automatically group all statuses in Progress cycle as defined by the Jira status category “In Progress”. My assumption is that this is causing issues with the data in your report when using measures “Issue Progress start date” and “Issue Progress end date”.
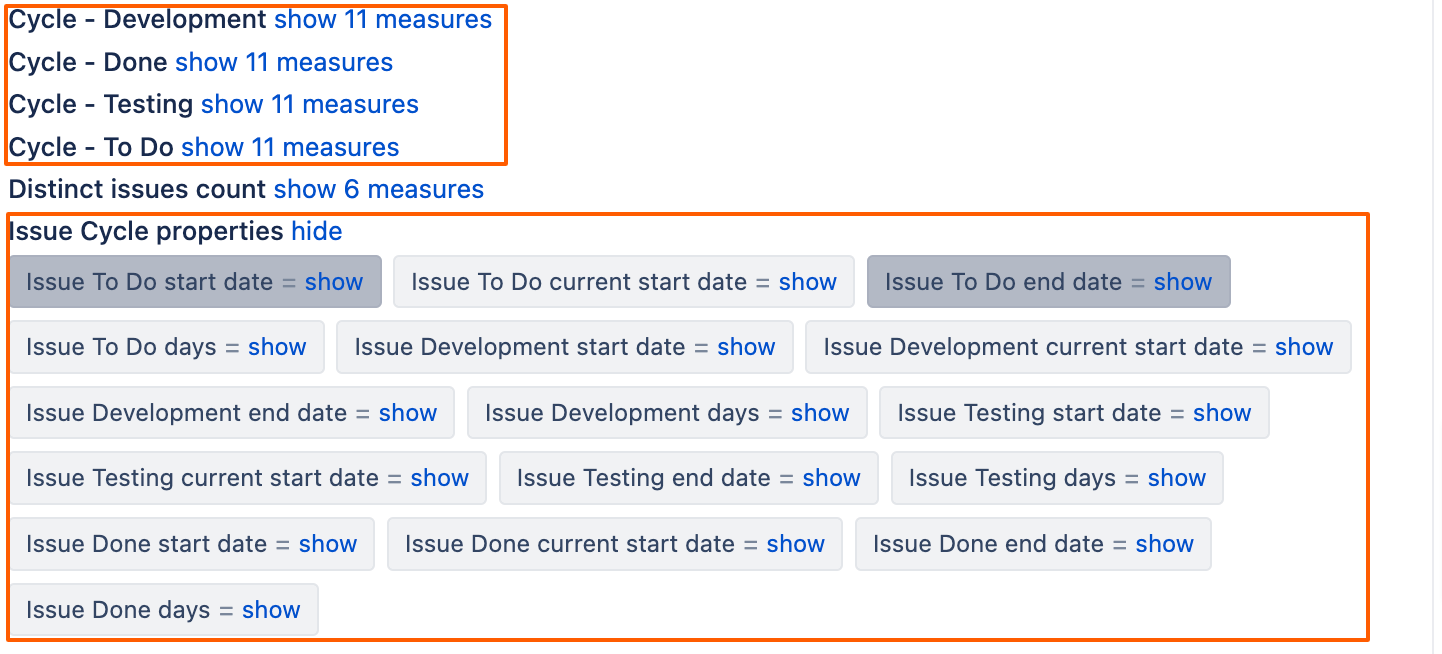
define and add specific Issue cycles for each one of the columns of your board. In my example below, I am arranging different statuses in 4 different Issue cycles.
That’s exactly what I was looking for, the only issue I see is that such a change would affect the entire organization since we have several teams using eazyBi. In this case I guess I can create a separate source application just for the projects which need this?
These changes would apply on the Account level, so if needed you can create a separate account for the reports where you would need to use these Issue cycles.