Hello,
Do you have some gauge chart with a middle threshold?
Example:
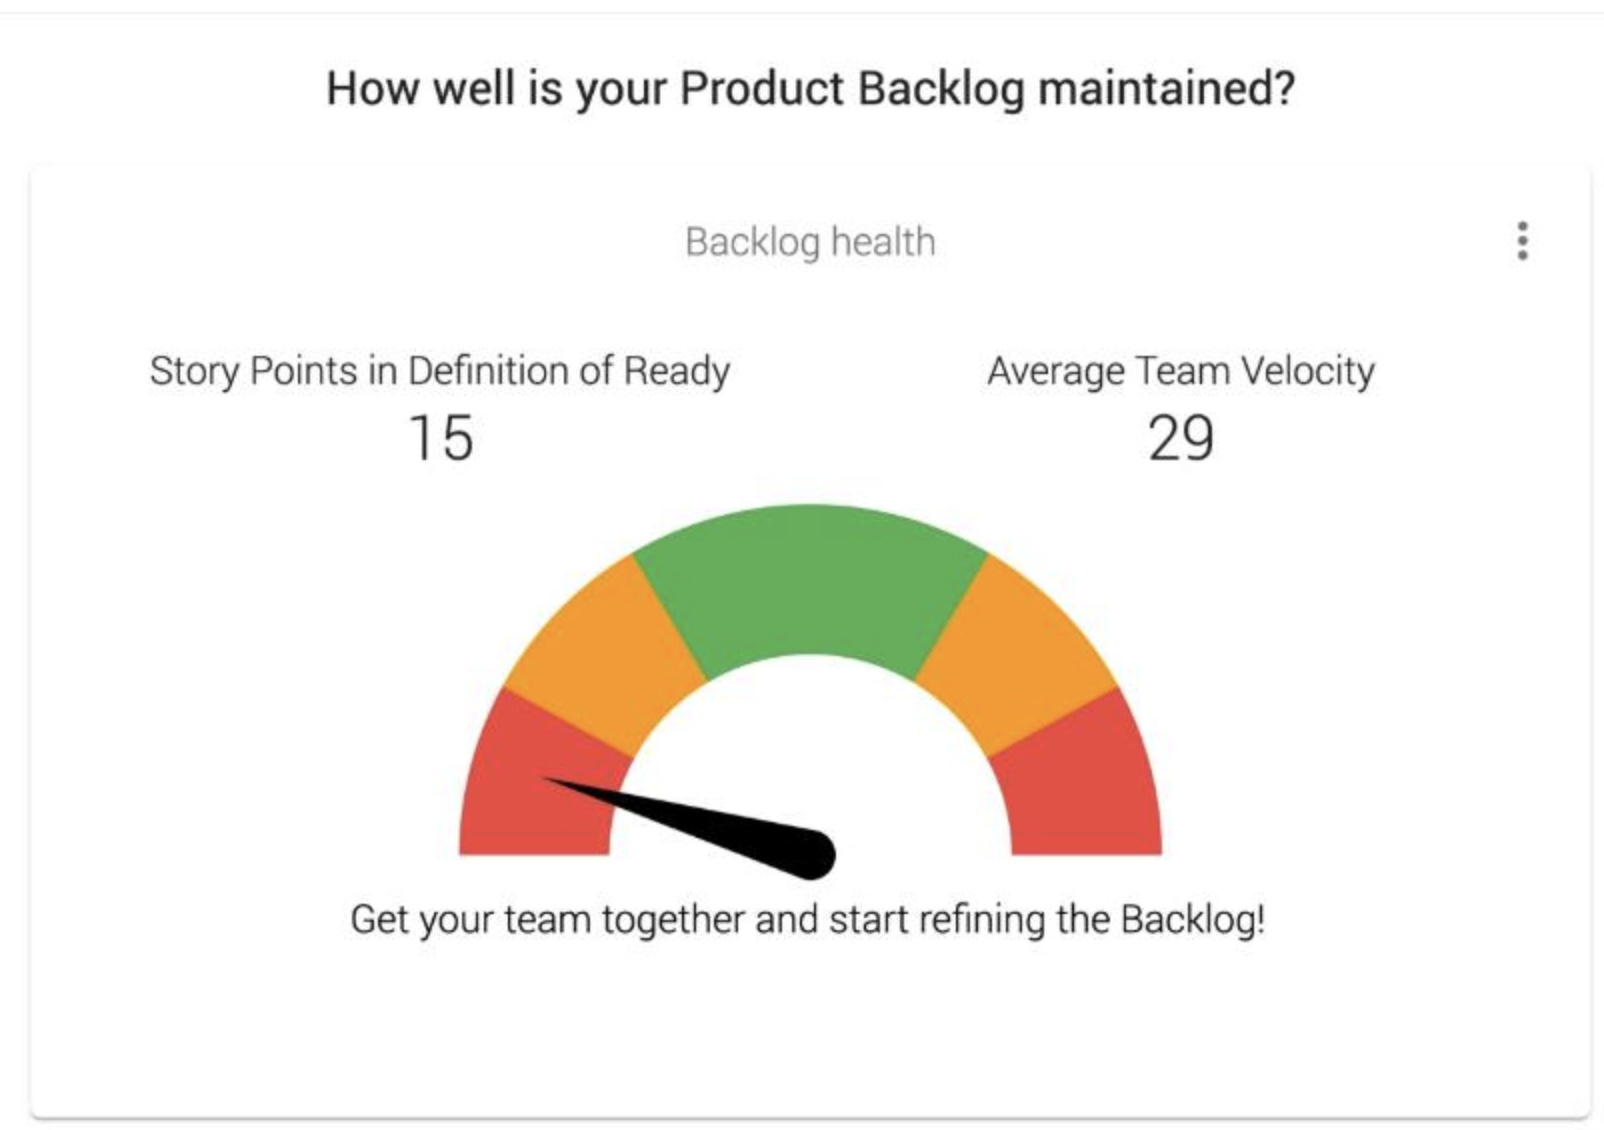
We want to see in this way velocity deviation.
Thanks in advance.
Hello,
Do you have some gauge chart with a middle threshold?
Example:
We want to see in this way velocity deviation.
Thanks in advance.
Hi Anton,
Currently, there is no such gauge chart option. We have an idea in the backlog to add a Dial view to gauge chart options.
There are options to customize available chart types in Jira; there is also an example of an angular gauge chart in Private eazyBI documentation. Maybe this helps to find an option to add or customize the gauge chart in your eazyBI app.
Lauma / support@eazybi.com
Hi Anton_Kruglikov, im very insteresting about this gauge, have you success with it?. I need draw a DOR EazyBI report too.
Can you help me sharing your solution?
Thanks in advance.
Rodrigo.
Sorry, but not, I didn’t manage to implement this 
OK, Thanks Anton.
Best