Hi Team
How can I set the limit value equals to Total of issues created on the Gauge Chart?
I’m trying to show the percentage of issues resolved vs total issues created, something like this:
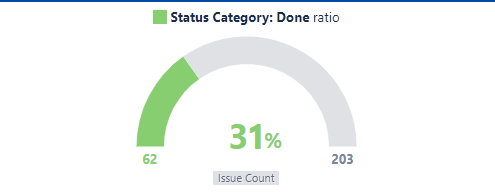
Any ideas?
Hi @Daniel_Luevano,
In a gauge chart, you can show the progress towards some value, but the chart does not do an additional calculation of the progress in percentage.
Some ideas on how to visualize the progress in absolute values and percentage,
-
Use Bar chart or Pie chart (donut) that has functionality to show values in percents.
Here is an example: Project progress % - Issues - Jira Demo - eazyBI -
Another option, define a new calcauted measure that would calculate the progress. Then you may represent all three metrics on the Gauge chart.
Here is an example: Version Progress Gauge (only values) - Issues - Jira Demo - eazyBI
Best,
Zane / support@eazyBI.com