Hello
I created a report to show average resolution workdays by month same this:
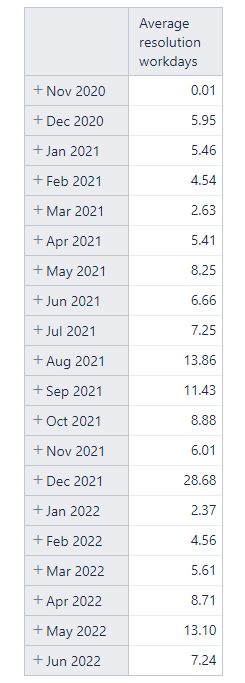
But I need to get only issues created after 2022 to get this number
What is the best way to solve this? Thank you very much
Hello
I created a report to show average resolution workdays by month same this:
But I need to get only issues created after 2022 to get this number
What is the best way to solve this? Thank you very much
Thank you eli_solutions but i need to filter data (issues) included to calculated member “average resolution workdays” not filter de result ![]()
Can anyone help me please ?
Hi @JTejada
Welcome to the Community! ![]()
The “Average resolution workdays” measure, by default, will return the issues that have been resolved in your selected time period, no matter when they were created.
To display only those issues that have been created this year, you can define a new calculated measure with the following formula:
Avg(
  Filter(
    Descendants([Issue].CurrentMember,[Issue].[Issue]),
    DateInPeriod(
      [Issue].CurrentMember.GetDate('Created at'),
      [Time].[Current year]
    )
  ),
  CASE WHEN [Measures].[Issues resolved] > 0 THEN
    [Measures].[Total resolution workdays] / [Measures].[Issues resolved]
  END
)
This formula calculates the average resolution workdays for issues that have been created this year.
Couple of things to note here:
If an issue is created in Feb and resolved in Apr, the resolution workdays will be counted towards April.
If an issue was created in last Nov, and resolved in Apr, no workdays will be counted.
Let me know if this fits your use case!
Best regards,
Nauris / eazyBI support
Hey Nauris, this has resolved my problem!
Wondering how can I use the same logic to calculate the AVG resolution rate of tickets created in 2022. I would like to include any resolution rate, so if it was created in 2022 and resolved in 2023, I want to count that too
You can use the Time dimension in Rows, filter by the year 2022, and use this measure:
Avg(
  Filter(
    Descendants([Issue].CurrentMember,[Issue].[Issue]),
    [Measures].[Issues created] > 0
  ),
  (
    [Measures].[Average resolution workdays],
    [Time].CurrentHierarchy.DefaultMember
  )
)
This measure will return the average resolution workdays of issues that were created in 2022 and resolved at any time period.
Let me know if this fits your use case! ![]()
Best regards,
Nauris
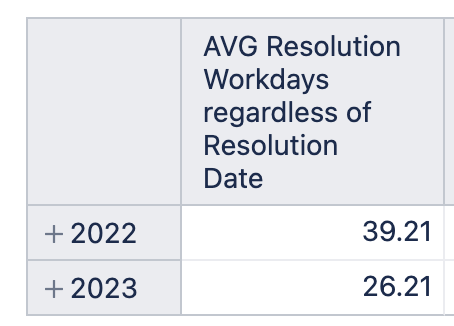
It looks like its working properly. When adding 2023, its no longer taking in tickets resolved from 2022 either, right?
If you have the Time dimension in the Rows section, then this formula will, for each row, return the avg resolution days for issues that were created in that time period.
So, in your case, yes, the avg days for year 2022 will be calculated only for the issues created in 2022, and for 2023 - only for issues created in 2023 ![]()
Best regards,
Nauris
Thank you so much for helping me out with this issue!
Is there documentation on how to write my own dimensions? Or at least to understand their format and how to read it?
Happy to help!
I recommend starting with watching these short training videos on the main concepts of eazyBI: Training videos
You can then check out the step-by-step instructions on how the Sample reports are created: Learn eazyBI through Sample reports
And finally, you can check out more advanced talks on more complex topics: Training videos on specific topics
Nauris