Hi, we have customized field created which is Planned capacity - it is a number field.
I am trying to create a graph which will show the total number of Planned capacity and estimates per month by decision.
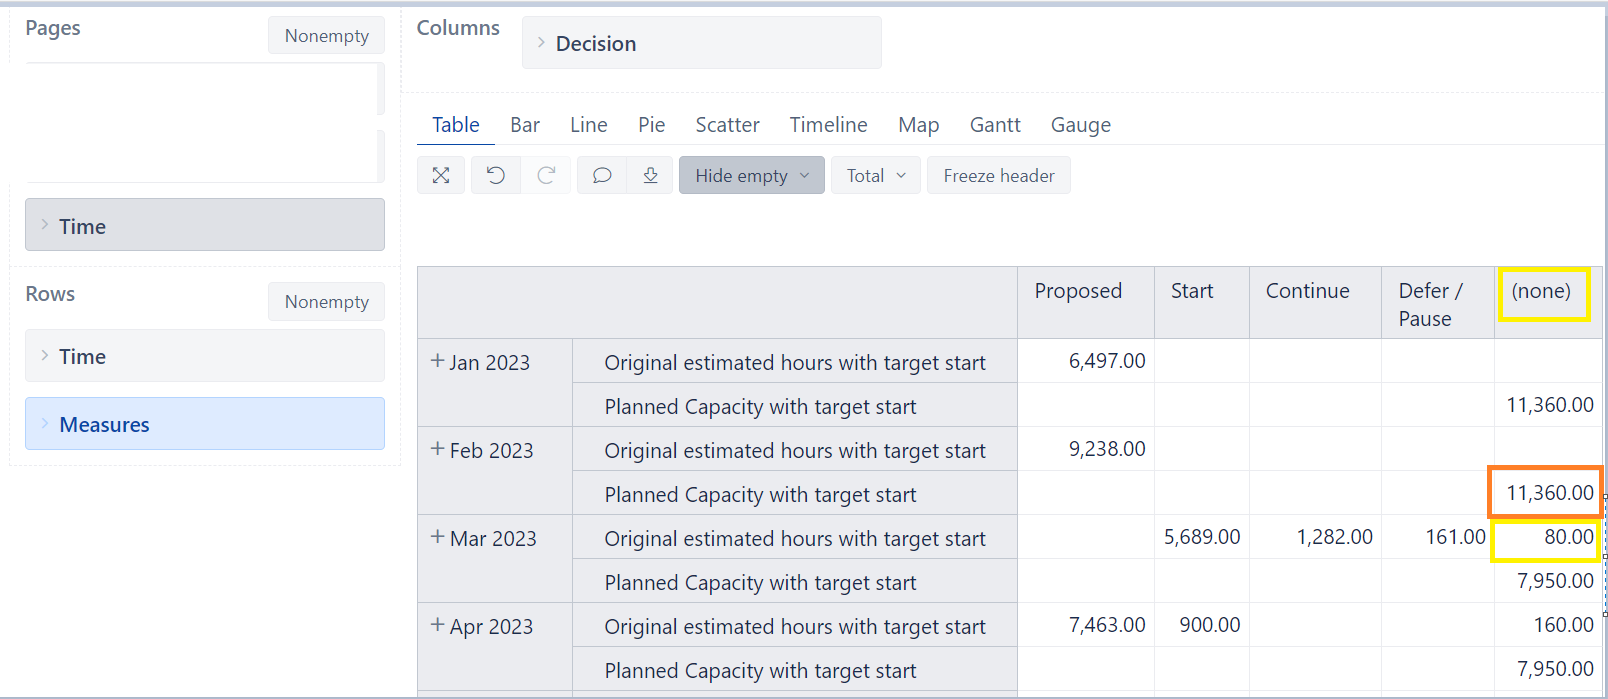
The planned capacity will always show as (none) for the decision field since this is not being assessed by the team.
I would like to separate the columns for A. (none) Planned capacity with start date and B. (none) for original estimated hours with target start . All the remaining decision will retain.
Do I understand correctly that you need to count planned capacity by the Start date, not by the Target start? Is the “Start date” a custom field? Then import it as a measure, and a measure “Planned Capacity with start date” will be created during data import; use it instead in the report…
Also, as Planned Capacity value is not displayed for other decisions, you may split only “Original estimated hours with target date” measure by decisions.
To do that,
temporarily remove “Decisions” dimension from the report
move Measures to columns
drill into dimension “Decisions” only from measure “Original estimated hours with target date”; read how to drill into measure by another dimension here: Create reports
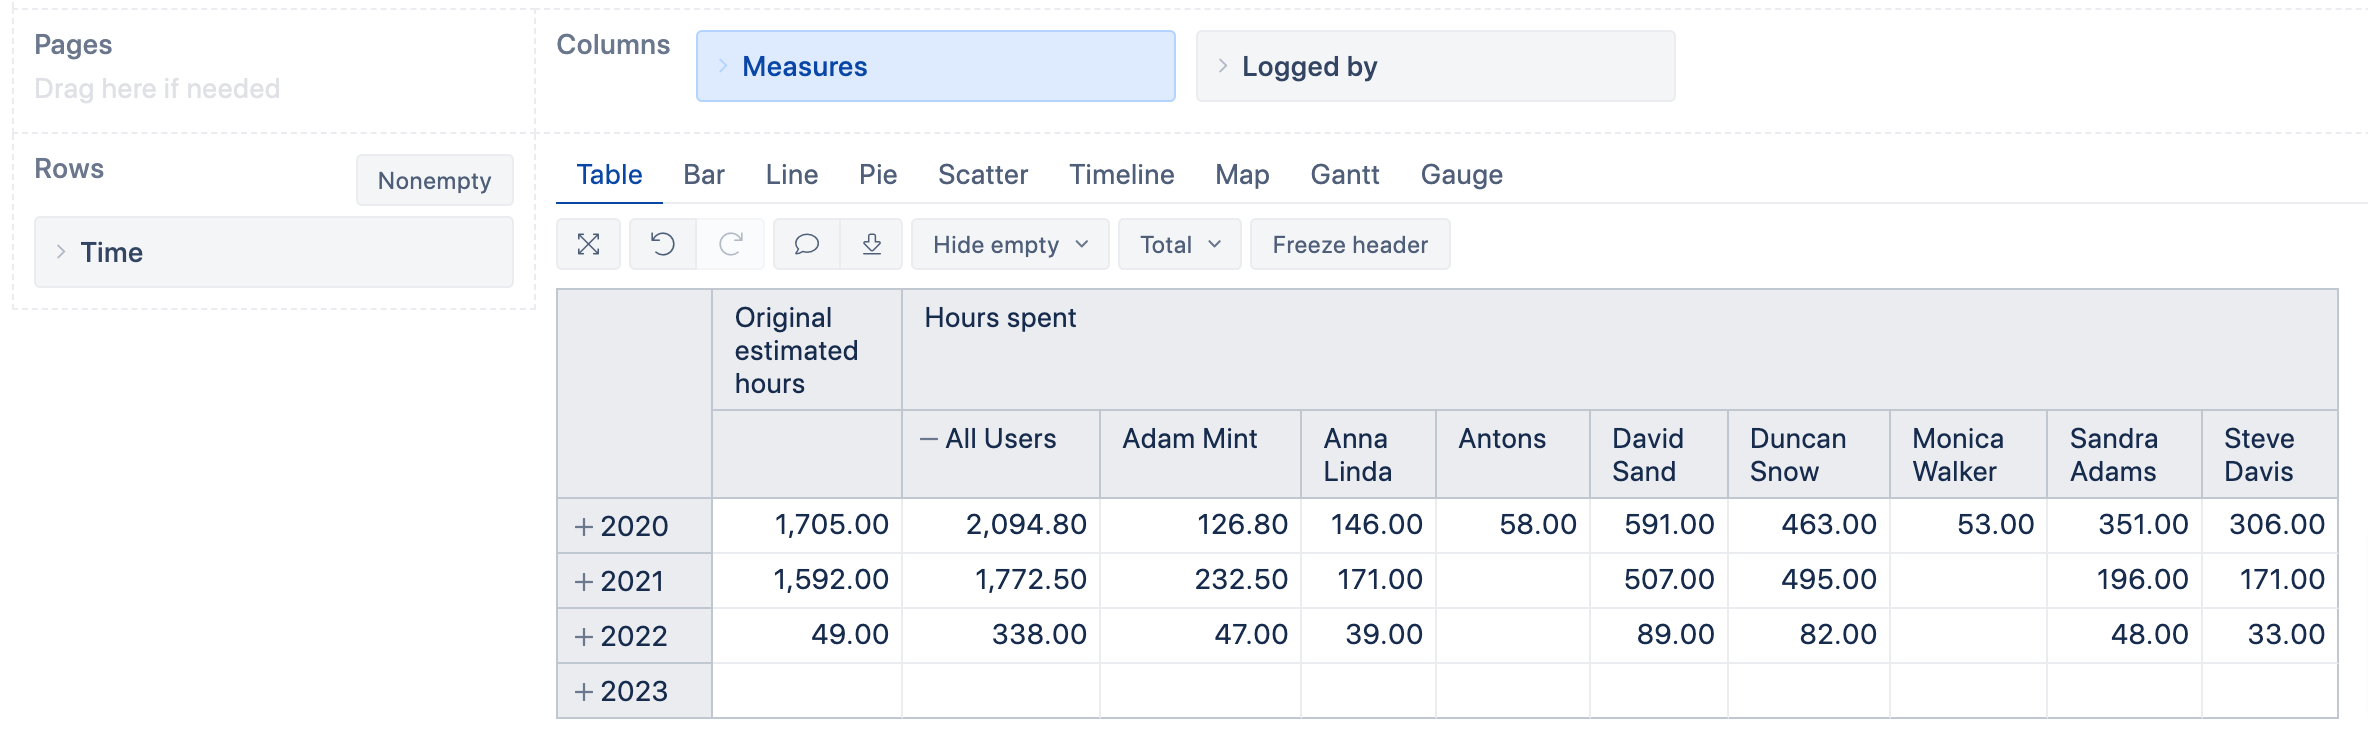
To illustrate how it would look, I used “Original estimated hours” and “Hours spent” split by Logged by in the example: