I’d like to get know if it’s possible to get issues from Team Backlog (not Sprint Backlog)?
We have the following structure:
One Jira Project for all teams, but each team has their own board. So, I’d like to see a number of issues in backlog per status for each team.
From your described use-case it seems you could be using “Kanban boards”
The issues related to the Kanban board can be reported in eazyBI depending on how your Kanban board is configured (note that you can base the Kanban board on a project or your custom filter). You need to apply the same filtering in your report to show the report for the Kanban board in eazyBI.
If that is not the case, please share more details on the criteria you use in Jira to enter teams boards.
Sorry for bad explanation, I will describe more detail.
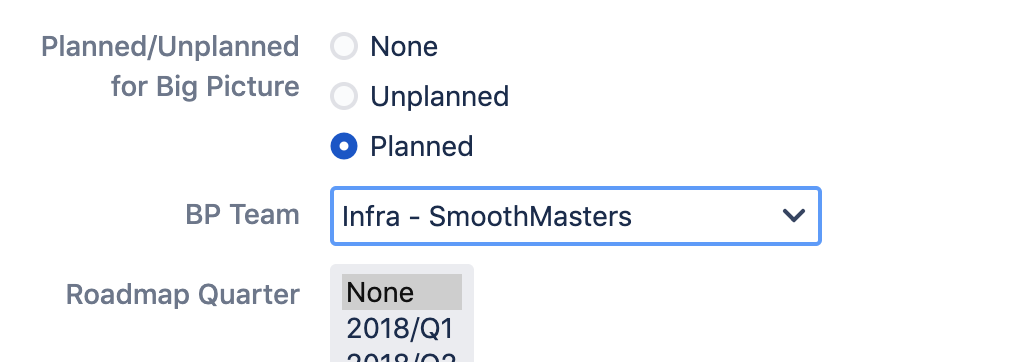
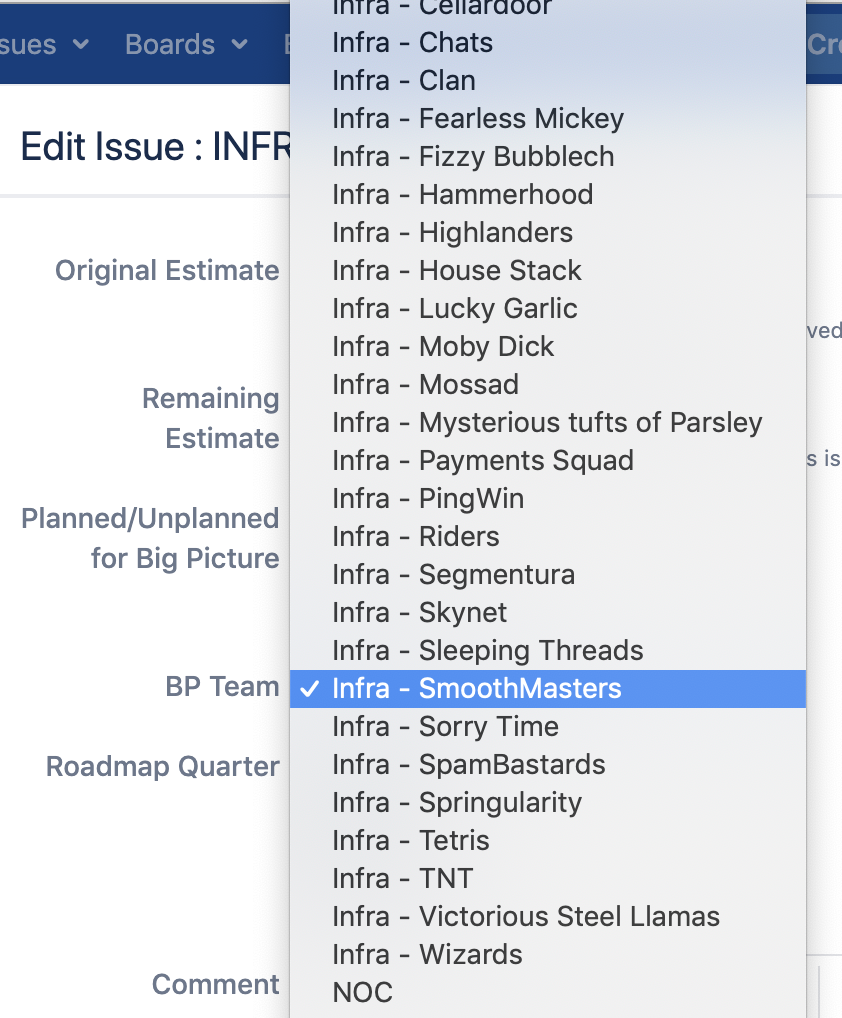
In Jira project we have field like ‘Team’ - it’s a drop-down, where we have list of teams: Team_1, Team_2 etc…
Each team board has the following configuration: project = Project_1 and Team = Team_1, project = Project_1 and Team = Team 2 . …
Then, each board contains backlog and sprints. Here is screenshot example:
So, what information we’d like to see is ‘Issues of Teams, which are not in Sprint (or Active Sprint), but in Backlog’. And then some additional info like ‘statuses of these issues’ etc.
I tried and did it, based on this article, but what the issue I came to is that in this case I cannot know the average velocity of the team, because ‘Team’ dimension doesn’t know anything about sprints.
That’s why I wanted to build it, based on ‘Sprint’.
Now I have 2 separate charts - one with ‘Backlog readiness’ (by ‘Team’), second - ‘Average Velocity’ (by ‘Sprint’).
Maybe you can suggest me something to merge this data in one chart?