I am new to eazyBI so it might be that my questions is pretty silly.
I would like to create a simple Gantt Chart for my epics follwowing the example from documentation.
I fail to get the epics into the row.
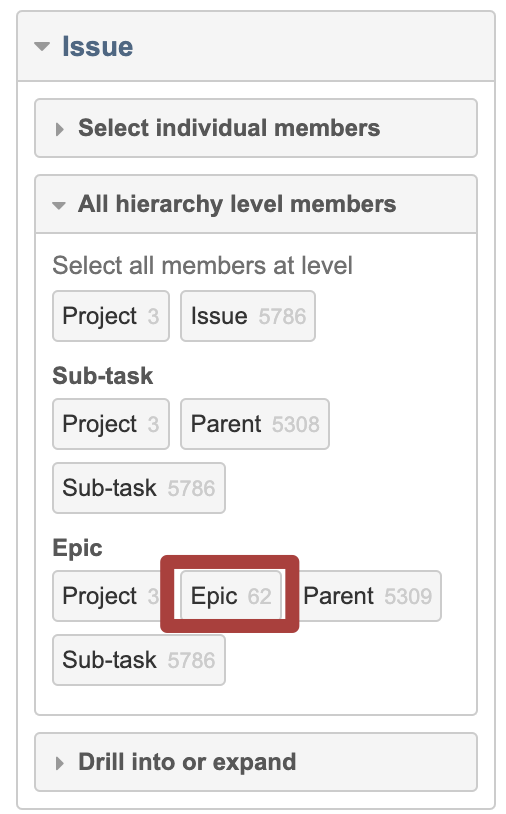
In the example “Issue” is moved to the rows and inside “All hierarchy Level members” “Epics” is selected to get the epics into the rows.
In my projecte I do not have the “Epic” option available.
How do I get this button?