I am new to working with cubes, and I am sure that I am missing a big picture item. I am trying to replicate some time reports we had from our former bug tracking with the Easy BI/Jira report.
My report has Time and Issues as rows and measures as column
For closed issues, I am trying to get a count by time period for various ranges of the time it took to close.
So, I have added a calculated member [Issue].[Days to Close] calculated by:
DateDiffDays( [Issue].CurrentHierarchyMember.get(‘Created at’),
[Issue].CurrentHierarchyMember.get(‘Closed at’) )
to give me the time per issue, but I can not reference this in measures when I try to create a calculated member.
I then tried calculating this directly in measures using a calculated measure [Measure]. [Time to Close] as
DateDiffDays( [Measures].[Issue created date],[Measures].[Issue closed date])
When I add this to measures, if I dig down to the issue, I see the value, but there is not sum of values on the time element rows up the hierarchy. My next step was going to add a measure for each range and count the values for that range.
I know I am in the weeds at a conceptual level. Can anyone help?
To show the values on a higher level you would need to do the Sum(…) of the measure that is being calculated on the issue level.
But before we go there, I would like to guide you to the Interval dimension direction, see https://docs.eazybi.com/eazybi/analyze-and-visualize/interval-dimensions.
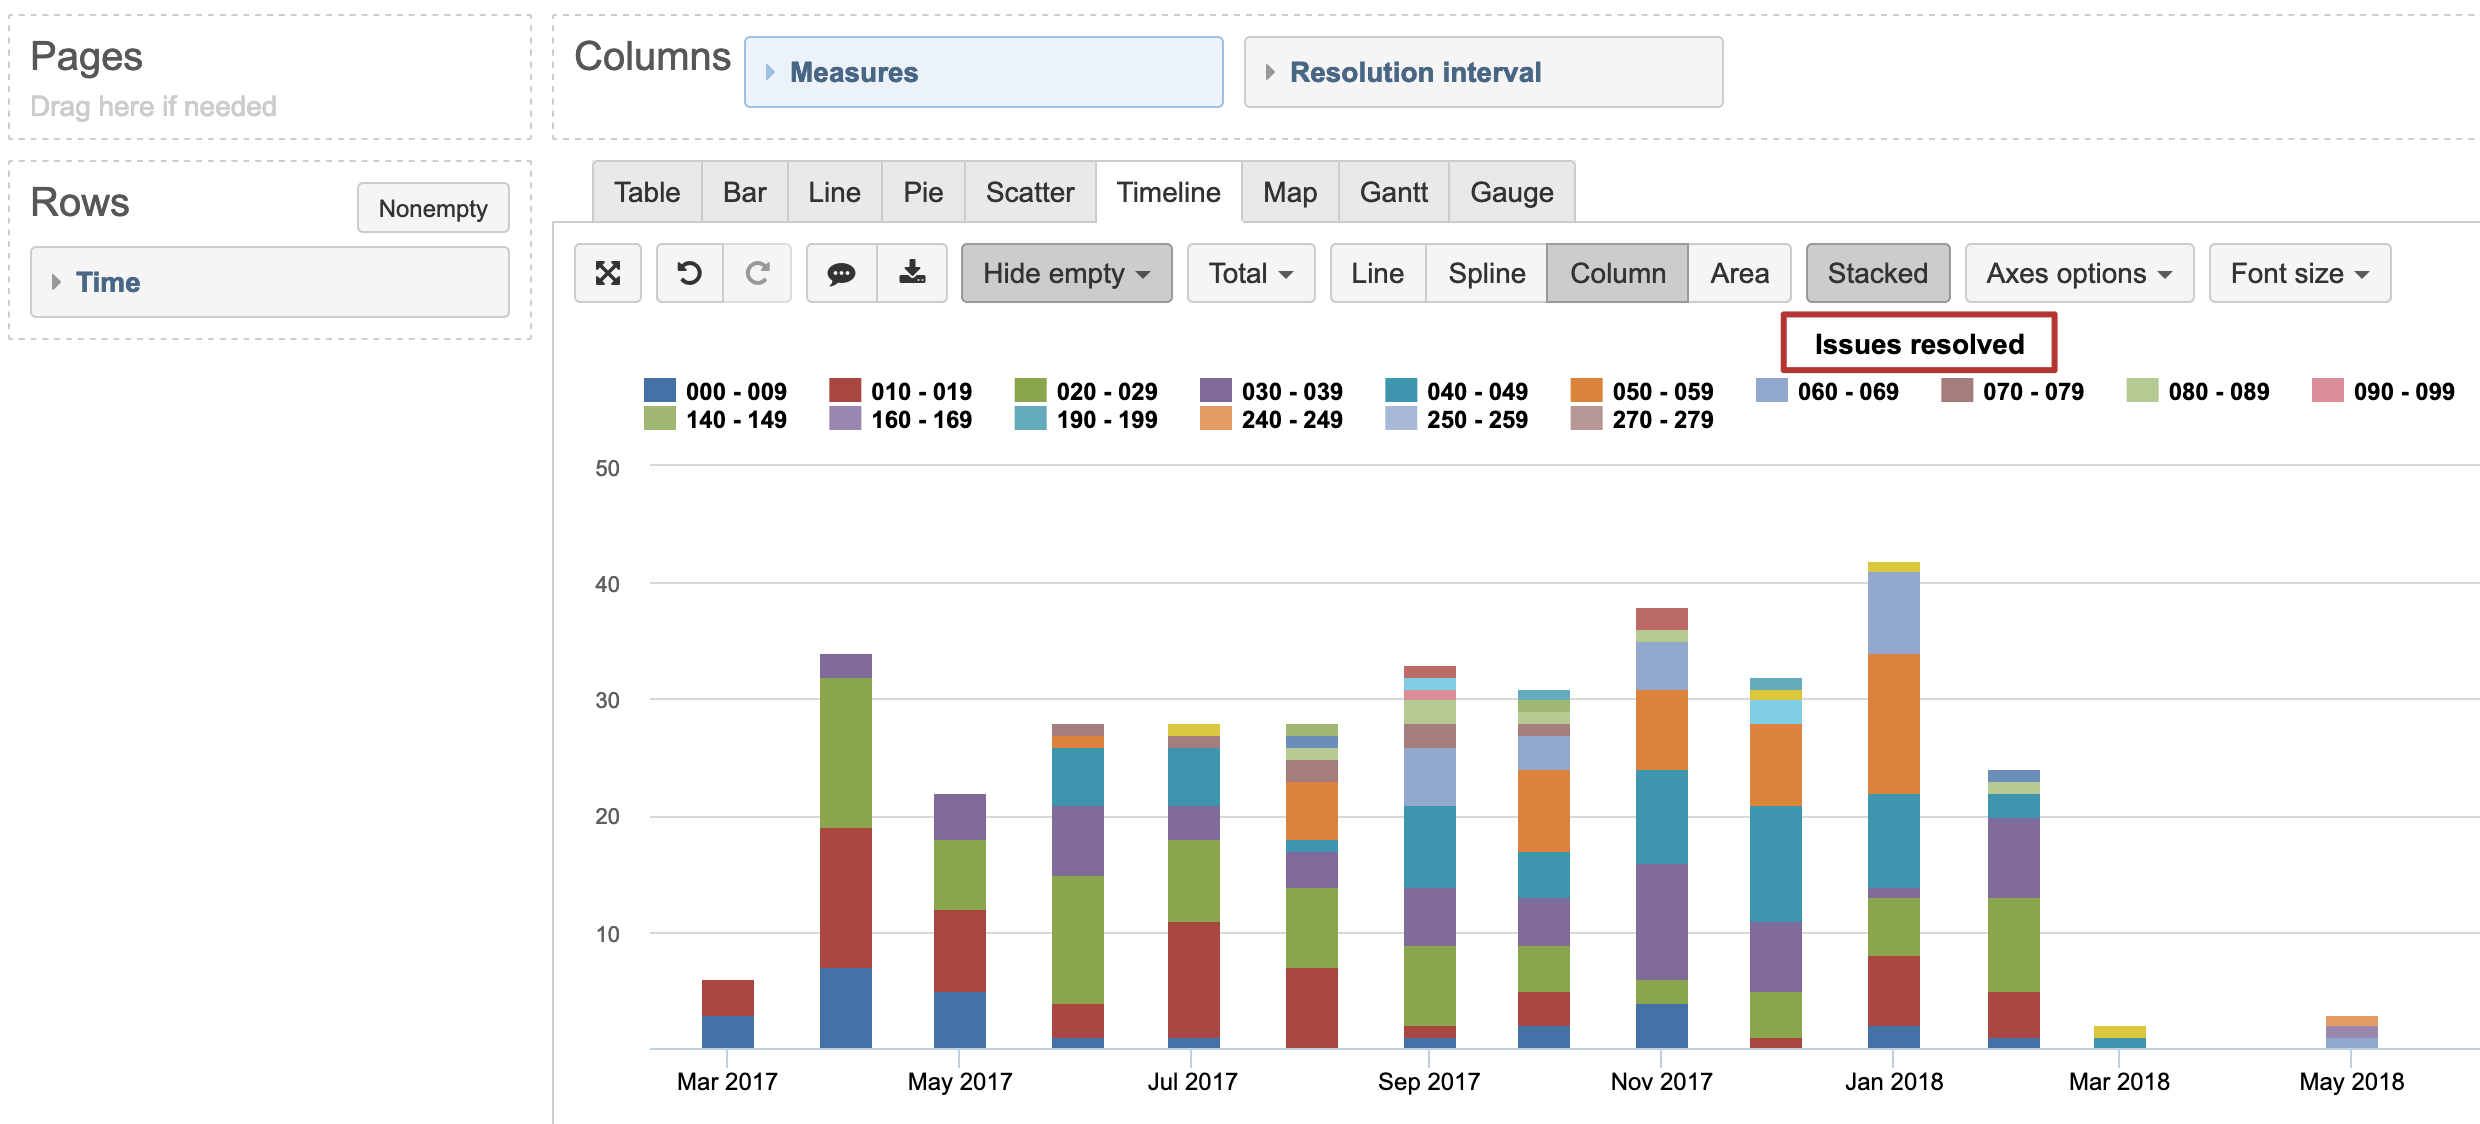
By default, if you select to import interval dimensions in the source data, eazyBI creates a Resolution interval dimension which calculates the days it took for issues from creation to resolution and puts it in the defined interval ‘bucket’. Together with Issues resolved measure and Time dimension this would show how many issues that are resolved in that time period were resolved in each interval
Thanks. I was able to solve this with help from others. The secret sauce was that there is a hidden measure that I could use [Measures].[Total closing days]. This can be found in the out of the box [Measures].[Average closing days].
Once I added this, I was able to create members to count the various ranges:
NonZero(Count(Filter(
–Itterate through all closed items in selected period
Descendants([Issue].CurrentHierarchyMember,[Issue].[Issue]),
DateInPeriod([Measures].[Issue closed date],
[Time].CurrentHierarchyMember)
AND
([Measures].[Total closing days]>7 AND [Measures].[Total closing days] <= 30
))))
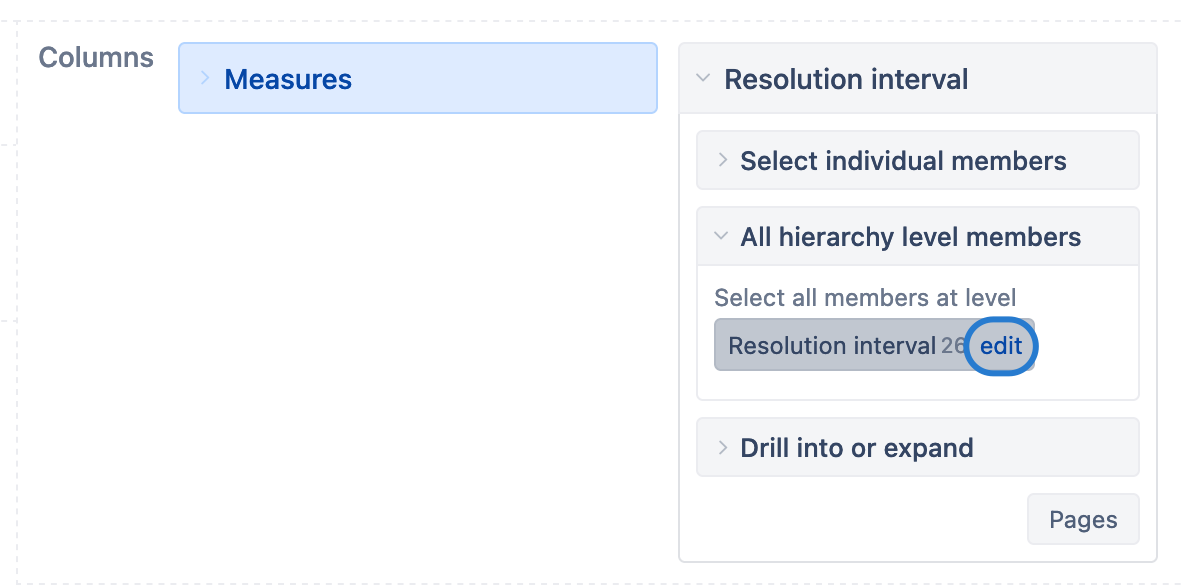
Hello - this explanation was helpful as I am running into the same problem. However, I am trying to change the interval “buckets” to different time periods (1-3, 4-10 days…etc). I am able to get the stacked bar chart, but still not clear how to change the time intervals. Can you please assist with some detailed information on how to accomplish this.