My organization uses two-week sprints, with three sprints making up one iteration. I have been tasked with creating some charts illustrating development activity over these iterations.
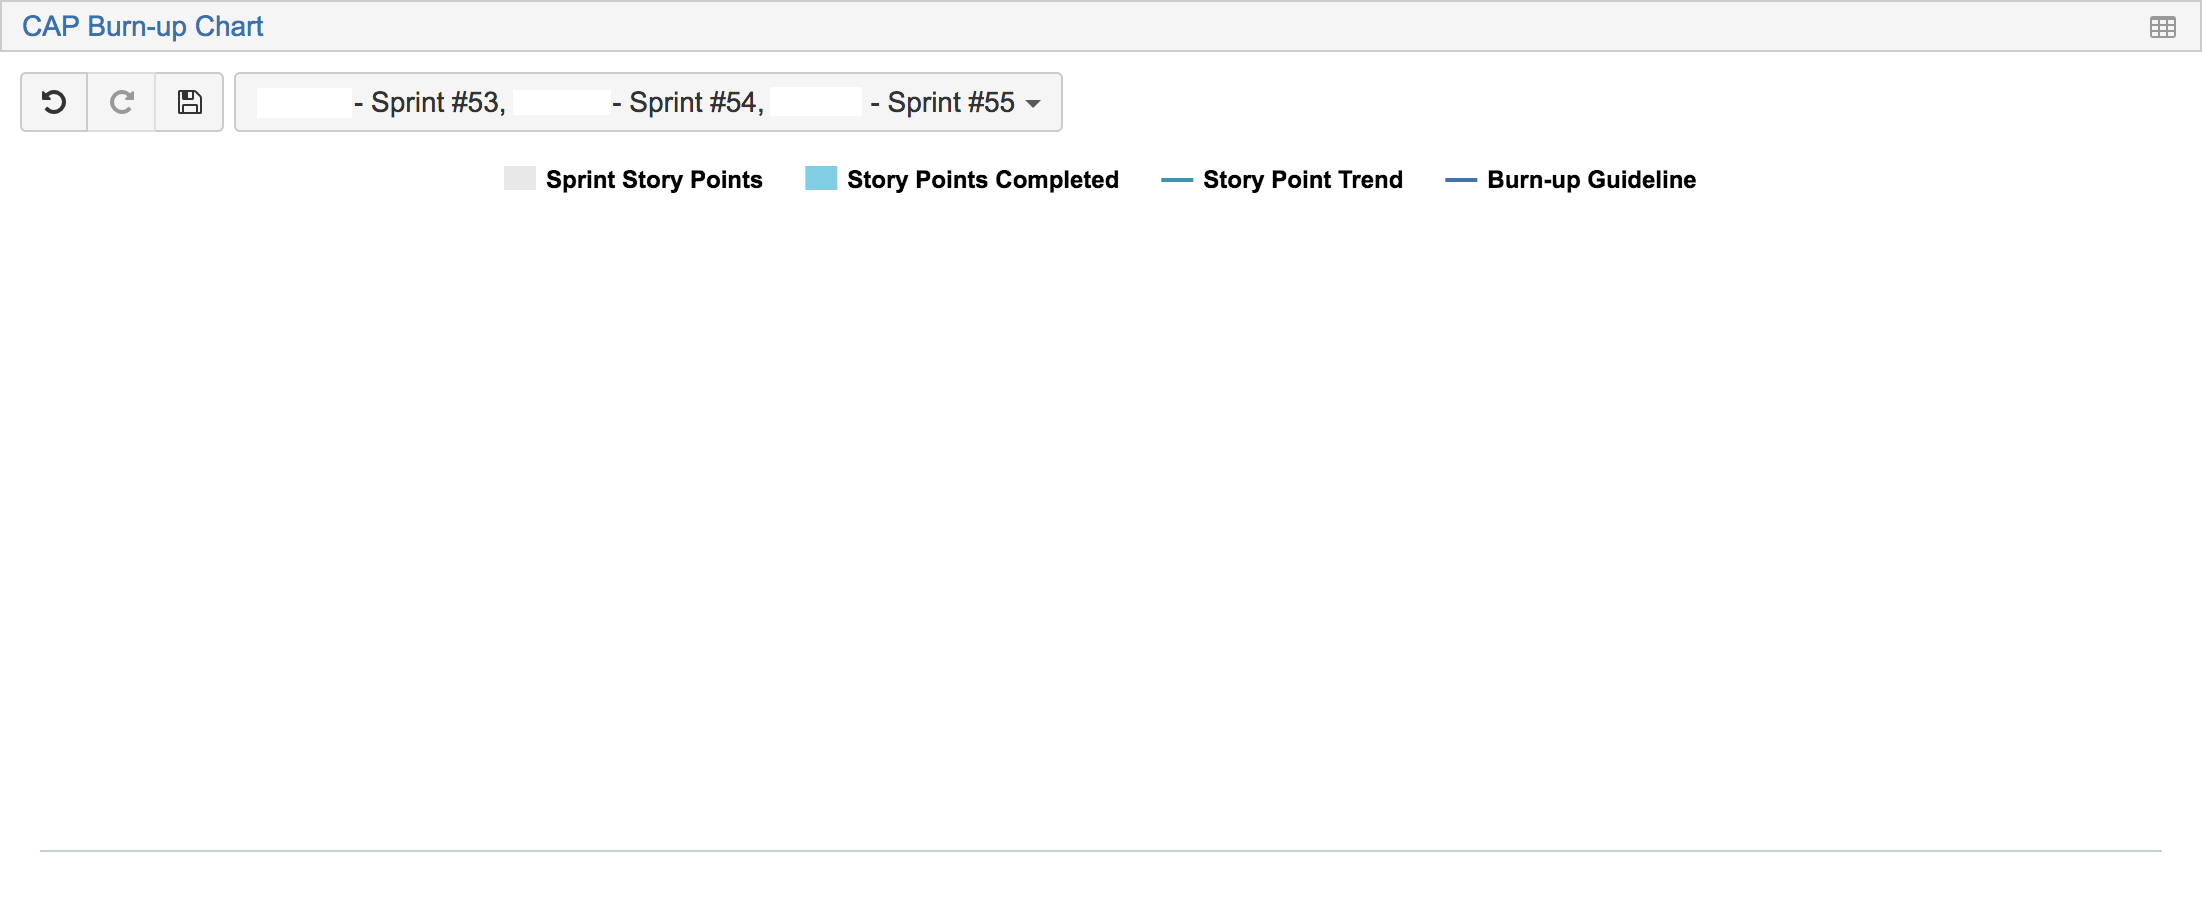
My first attempt, a simple burn-up chart, works when I select a single sprint:
(Your software does not allow me, as a new user, to attach more than one picture to this post. Imagine a burn-up chart here.)
But when I use “multiple selection” to select the three sprints that make up this iteration, the chart becomes blank:
How can I graph three sprints’ worth of data on a single chart?
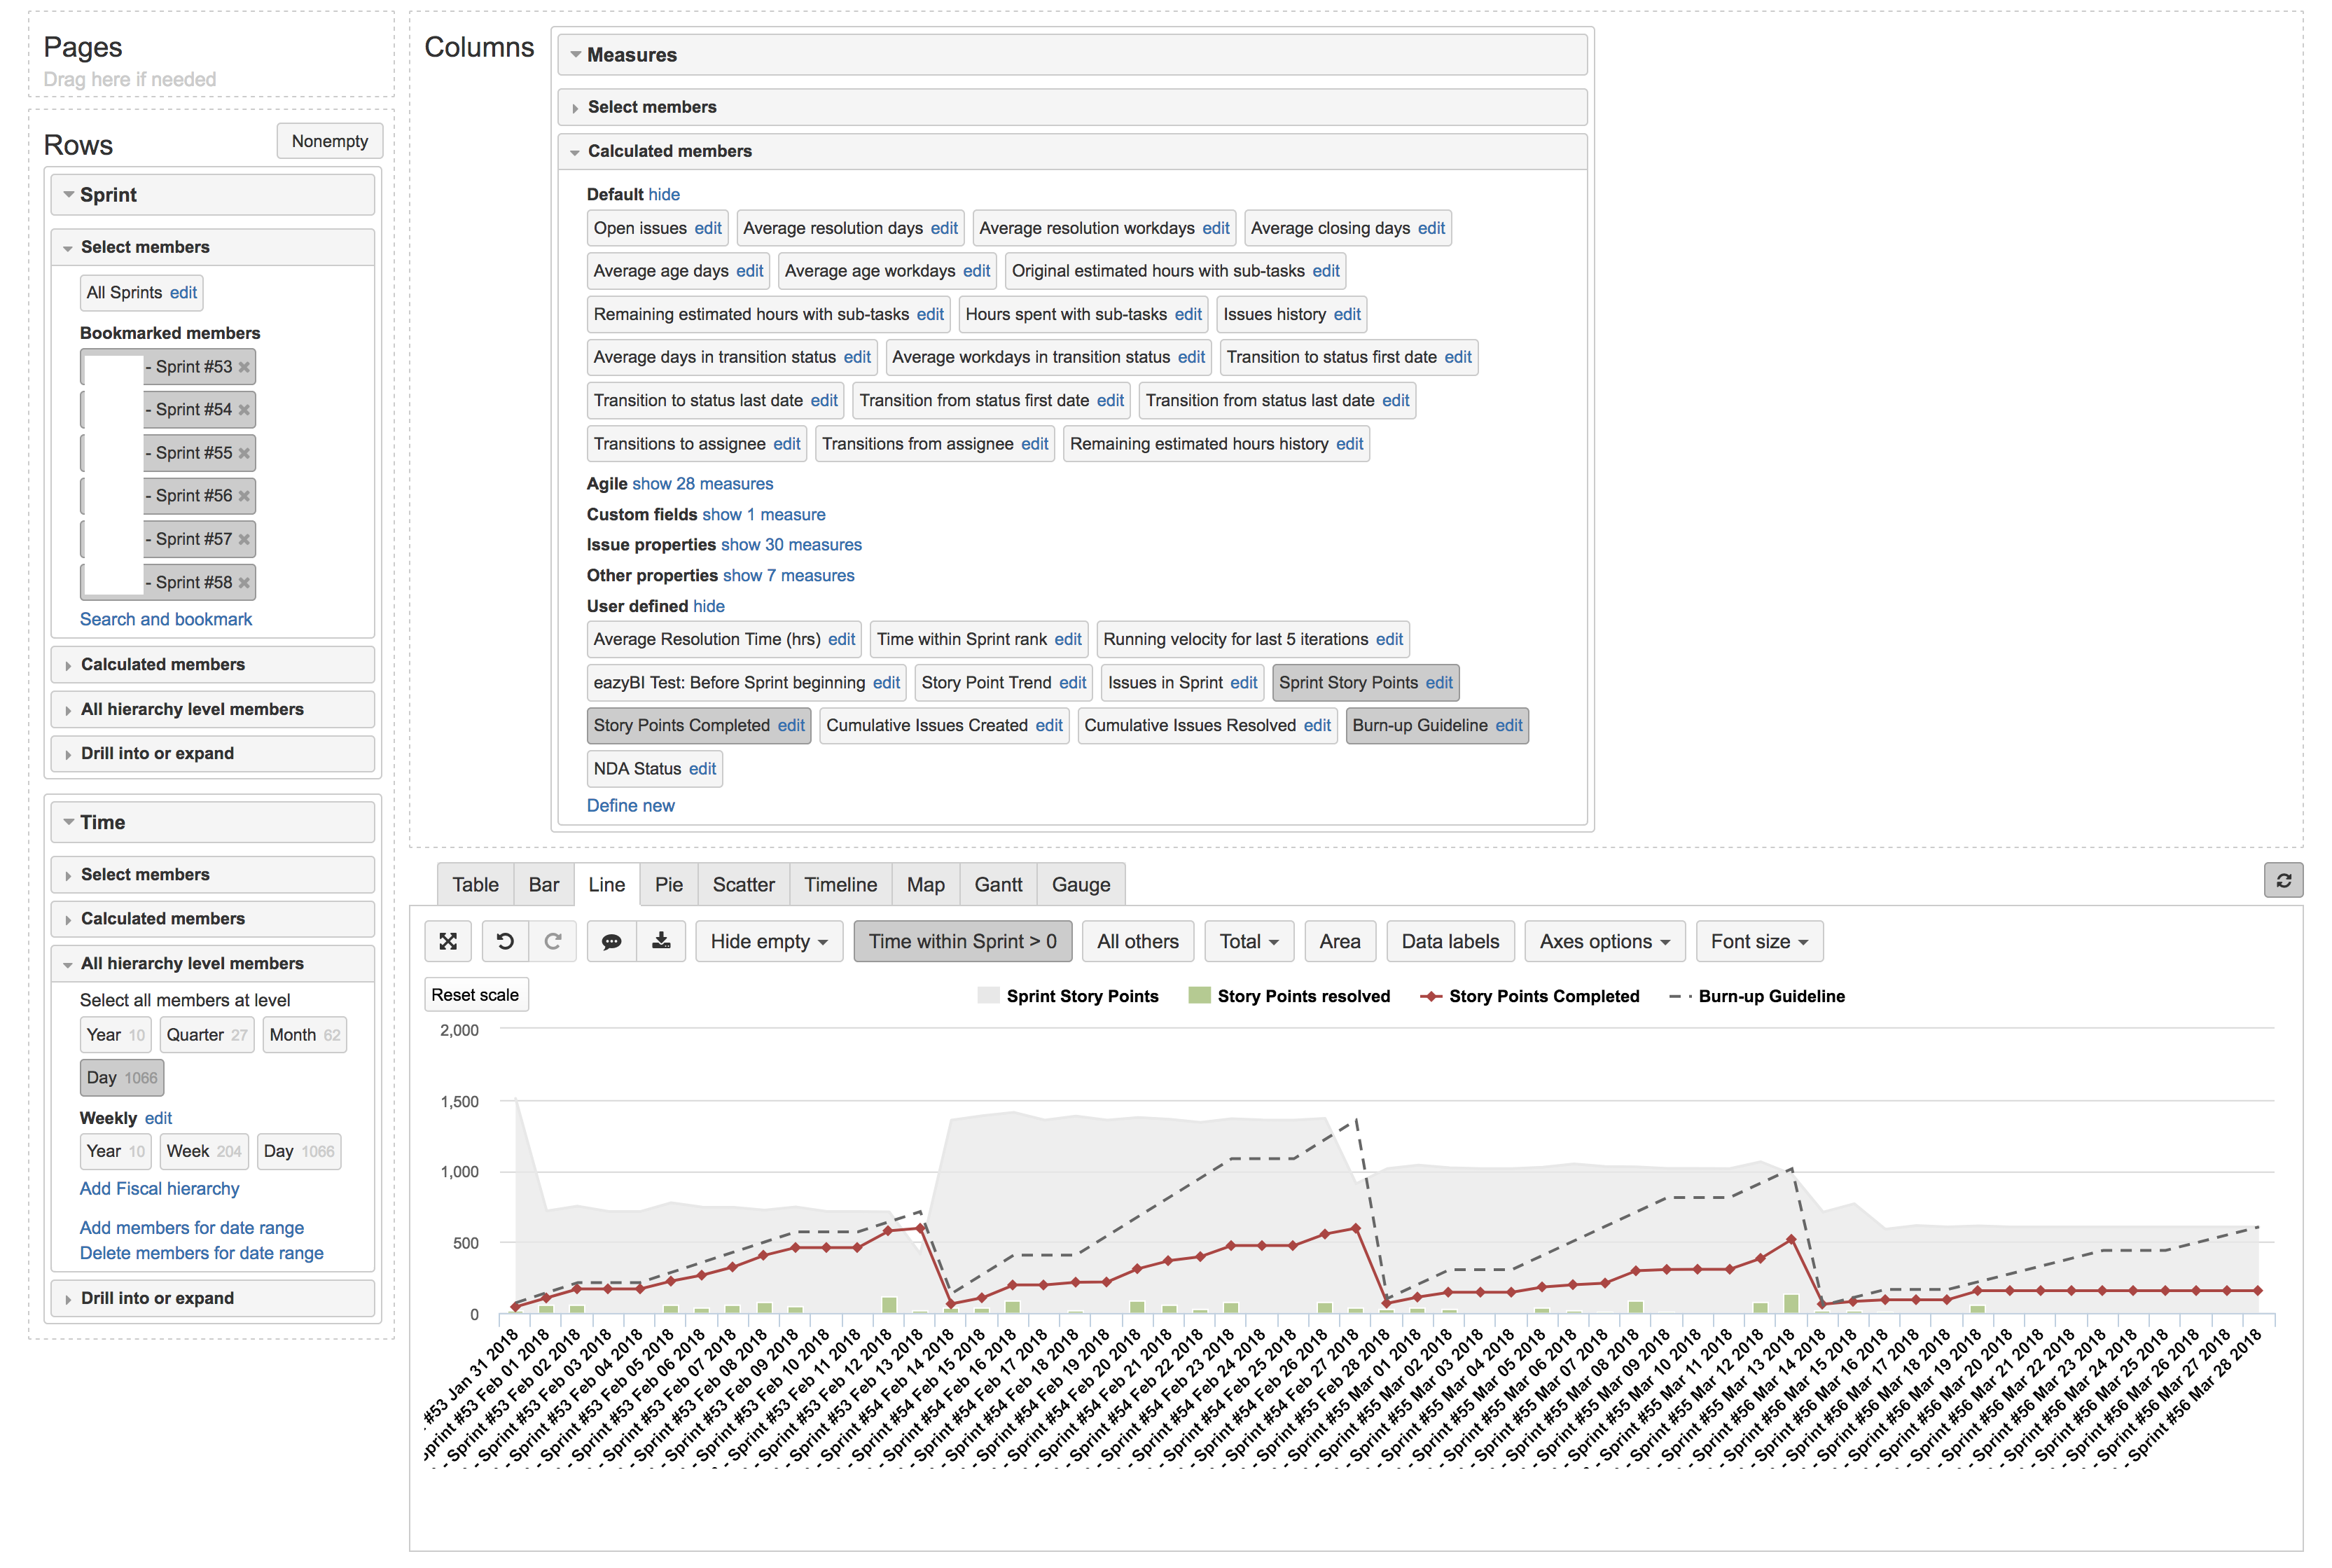
I was able to work around this issue by using “Sprint” as a Row dimension rather than a Page dimension. This is less convenient, as to change the graphed sprints we must edit the chart, search for and bookmark the desired sprints, then save the chart. If it worked as a Page dimension, we could simply use the drop-down box + multiple selection to change the graphed sprints at will. For this reason, I do not consider this issue to be solved.
Hi,
Thanks for the update.
To make the sprint burndown(burnup) charts work for several sprints, the first thing to do is to adjust the “Time within sprint” measure (I assume you have used a calculation like that) which might not be working in the case when multiple sprints are selected from the report pages. The formula for several sprints would be following:
CASE WHEN
  Sum(Descendants(
    {[Sprint].CurrentMember,
       ChildrenSet([Sprint].CurrentMember)},
      [Sprint].[Sprint]),
    CASE WHEN DateBetween([Time].CurrentHierarchyMember.StartDate,
      DateAddDays([Sprint].CurrentMember.get('Start date'), -1),
      [Sprint].CurrentMember.get('End date')
    ) THEN 1 END
  ) > 0
THEN 1
END
Further adjustments needed depends on how your measures reference the “Time within sprint” measure.
Kindly,
Janis, eazyBI support
1 Like
Where would I make this change? I tried using your query as a custom measure called [Time].[Multi-Sprint View], but if I use it as the Time measure my chart goes blank even in the previously-working case where I use Sprint as a row instead of a page.
Currently, my chart has the following:
Rows: Sprint -> A few bookmarked members, Time -> Daily Hierarchy
Columns: Measures -> Several calculated measures