Hi,
I’m trying to create a graph of storypoints estimated vs number of workdays in development. I’ve imported storypoints as a custom dimension (as image) so for each issue can see the storypoints and number of days.
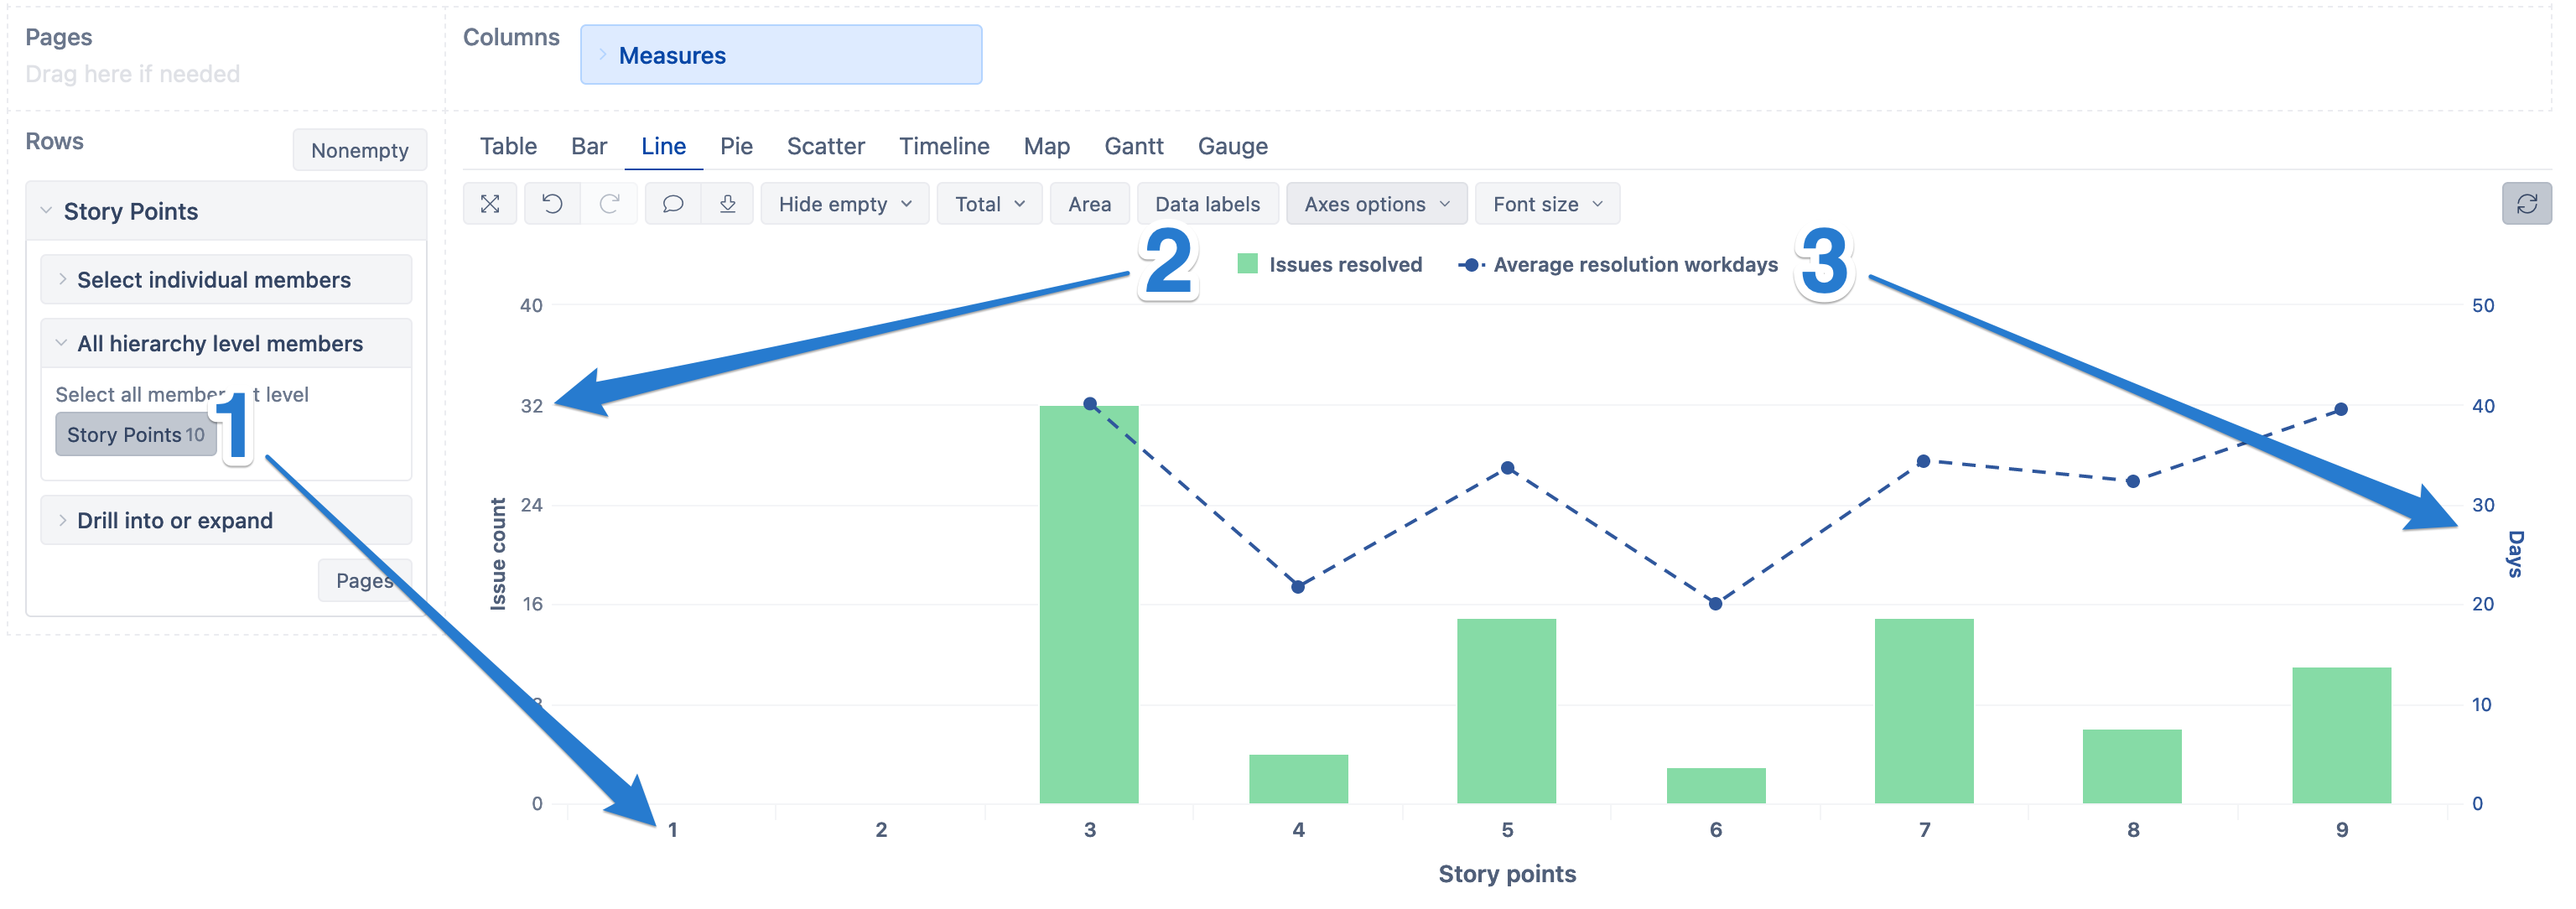
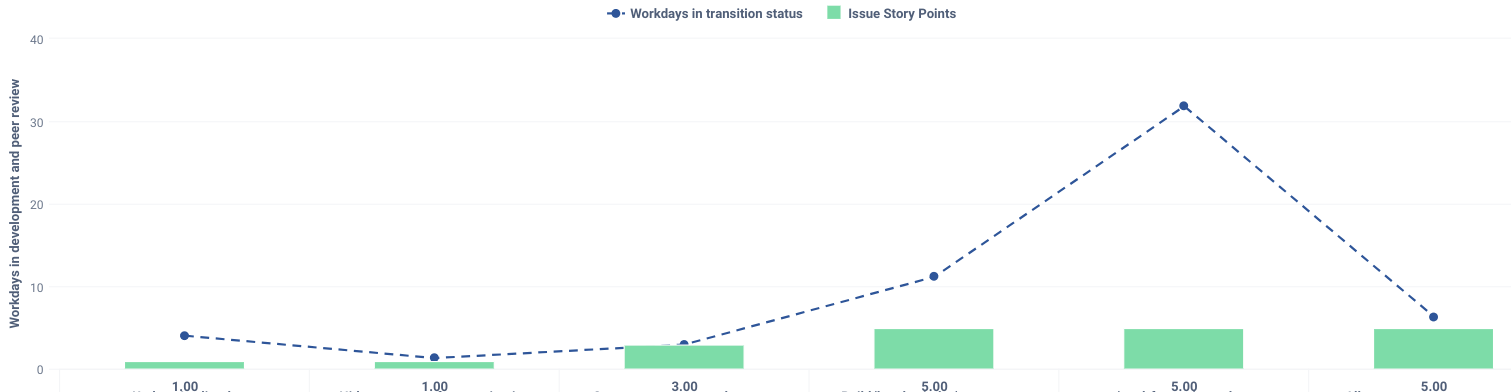
What I would like to see is unique values of storypoints across the X axis (1, 2, 3, 5, 8). Up the Y axis I would like to show scatter points of all the issues which have the given number of storypoints associated with them
How can I group the storypoints on the X axis so that I remove duplicates and show multiple issues for each storypoint value?
Thanks,
Hannah