Problem is the Measure (Issues created). I have a dimension custumor and the relation between Issues and customers is n to 1. So it is possible to have 8 issues created for 1 customer.
I now need to report on a group by on customer, so my measure isn’t “Issues created”, but “unique customers”.
e.g now it says for in production in 2019 “8”, but it are only 3 unique customers, so I should have 3.
I have a calculated field “Issue_Customer”
[Issue].CurrentHierarchyMember.get(‘Customer’)
But with this I only have empty fields.
I tried following syntax:
Aggregate({
[customers].Members})
but this doesn’t work. Anyone out here that knows the right solution?
The issue property “Issue Customer” will work only with individual issues in the report - Issue dimension “Issue” level members.
Try defining a new calculated measure to count the number of customers for the created issues. That requires the customer field imported as a dimension. See an example with the “Squad” field below:
Thank you very much, it works!
But now I have an other problem.
I need a calculation on this calculated measure, but it doesn’t to the calculation. It’s a calculated field that I use in the rows. It works when I use the calculated field “Issues created” but not when I use the calculated field “unique customers”.
Case WHEN
[Label].CurrentMember.name = “1”
THEN
([Status].[in production],
[Measures].[unique customer]
)/30
WHEN
[Label].CurrentMember.name = “2”
THEN
([Status].[in production],
[Measures].[unique customer]
)/100
END
When I use 'issues created" as calculated measure, it gives me the correct percentage. When I use “unique customer” as calculated measure, it just gives the total of [in production], no percentage.
My formatting is on decimal percentage.
Is it possible that EazyBI doesn’t recognise the measure as an integer due to the “count” syntax?
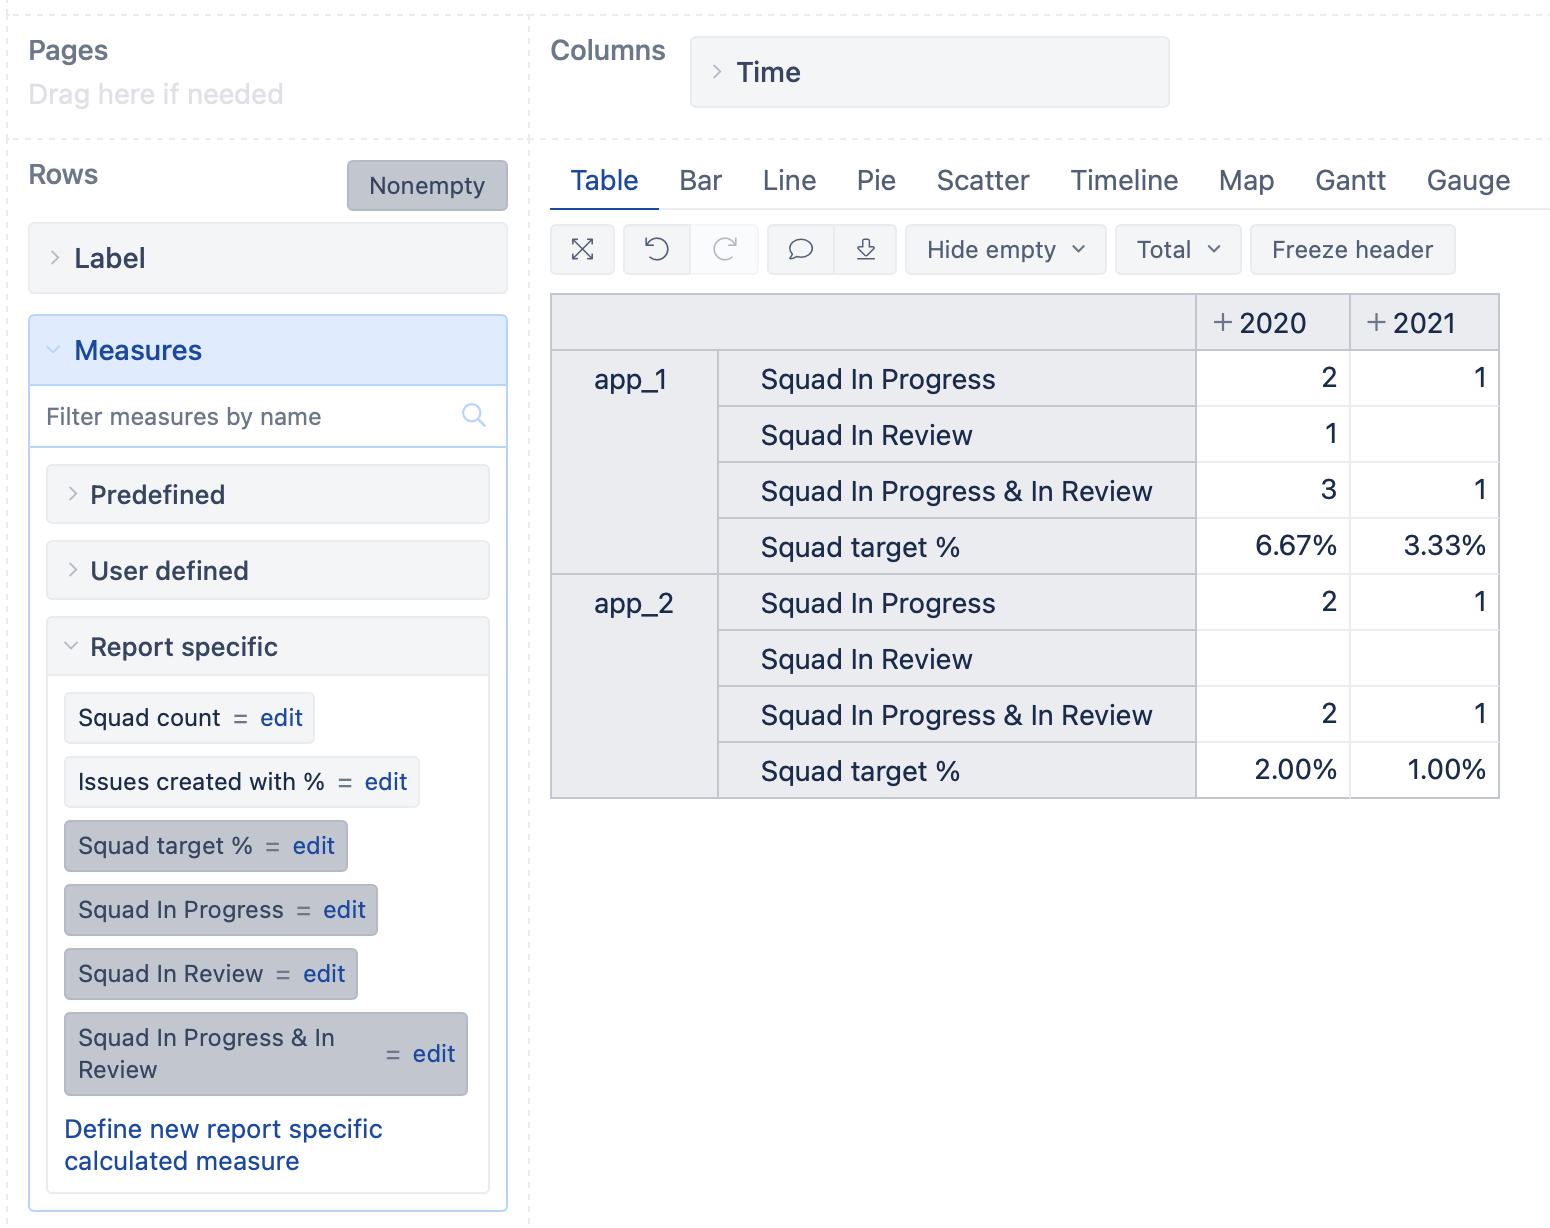
I don’t recommend defining such calculations in a dimension calculated member. Those are better of in Measures. If you need only the number of customers, I recommend a different approach where you remove the Status dimension from the report and move Measures to the rows.
Then define calculated measures to display the number of customers in each Status. For example, the number of customers in the “In Production” status can be calculated with the formula below:
Then you can define a calculated measure for the target percentage with a formula similar to the one you defined in the Status dimension calculated member and use the percentage formatting. The report then could look similar to the one below:
It works, but I get different outcomes. Very strange. With the measures in colums, the results are correct. Measures as a row gives me different results.
I am searching why…