Hello,
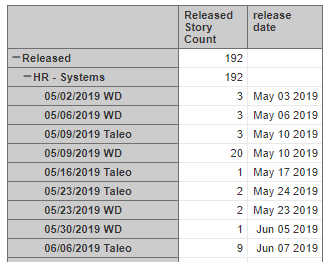
I have an issue that I just cant seem to figure out. What I’m trying to do is count the total number of stories released per month. I can pull the actual date of the release, and can get the story count for the release. However, when I try to bring in the Time dimension, it seems to want to count the story in the month it was closed, not released. So, for the below example, I need a calcualation that will give me a month by month total of resolved stories.
Hi @jchouinard ,
You can write your calculated measure in Measures what will sum Released Story count based on the fix version release date (and not on issue resolved date). The formula looks like this:
Sum(
Filter(
    --set of released fix versions
    [Fix Version].[Version].Members,
    DateInPeriod(
    [Fix Version].CurrentHierarchyMember.get(‘Release date’),
    [Time].CurrentHierarchyMember)
    ),
--released issues ignoring resolution date
([Measures].[Released Story Count],
[Time].CurrentHierarchy.DefaultMember)
)
To build the report what you are interested in, I would suggest checking our demo account example - “Versions on timeline” https://eazybi.com/accounts/1000/cubes/Issues/reports/50020-versions-on-timeline
For your use case, you can change the “Issues resolved” measure to the one that you create using the formula above.
You can use this example by exporting/importing report definition and then making changes so it suits your needs.
best wishes,
Gerda / support@eazybi.com
Awesome!! Thank you so much!!