Hi all,
I’m new to creating reports with EazyBI - so sorry if my general understanding is not the best yet ![]()
I want to do a report on our cycle times of issues. For that I have two part-cycles: one for the analyse / concept phase and one for implementation. Both in include several status in our workflow. For my problem it’s enough to only look at one of the two cycles (as they would work similar at the end - just with different status included.
I created a measures calculating the workdas between entering the phase (in our case moving into state “Analysis” and leaving the phase (in our case entering the state “Large Solution Backlog”):
PrepCycleDuration=
DateDiffWorkdays(
(TimestampToDate(([Transition Status].[Analysis],[Measures].[Transition to status first timestamp]))),
(TimestampToDate(([Transition Status].[Large Solution Backlog],[Measures].[Transition to status first timestamp])))
)
This is working as expected and I can show the value per issue as a column while showing all issues as rows.
But actually I want to see an average per specifc time periods - e.g. per month. And (and that is the crucial part) the data-point that should be used to decide into which time period / months an issue has to be considered in should be the date the issue left the phase (so in this case: TimestampToDate(([Transition Status].[Large Solution Backlog],[Measures].[Transition to status first timestamp])
I would like to have on the rows a hierarchy: Years, months, issue and in the column the average value based on the hierarchy level I look at.
Something like this:
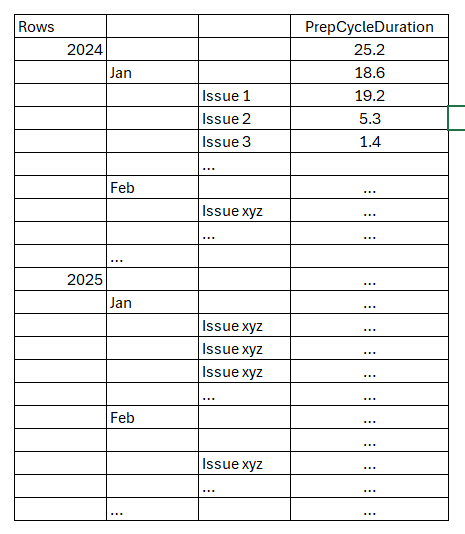
Would be great if someone could give me a hint ![]()
Thanks a lot & best
Alexander