Hi, im new to easyBi.
trying to create a report where on the rows, i have a list of issues (got that part). on the columns, i want the time each issue speant in each status, from time of creation, until now. also, i would like to show how much time has passed between 2 statuses (for example, between open and resolved, and between in progress and closed). i also need to add custom fields such that each issue will list its custom field value in the report.
i’ve added status for the columns, with a measurement of workdays in transition status.
couldnt get the count of days of each status for an issue.
have no clue how to add the calculated times between different dates
have no clue how to add the value of each custom field for each row.
please help!! 
Thanks
Hi @ben_friedman
Welcome to the eazyBI community!
First, you may want to use the default measures:
-
Average age days - from creation until now (for unresolved issues only)
-
Average resolution days - from creation until resolution (for resolved issues only)
Read more about them: Jira Core measures and dimensions - eazyBI for Jira
-
Days in transition status - days spent in each status. Drill into Transition status dimension from this measure to see how issue days are split by each status
Read more about this measure: Import issue change history - eazyBI for Jira
Also, how to drill into dimension from a measure: Create reports - eazyBI for Jira
Additionally, you may create new measures (in Measures) that counts days between two dates: for instance, the date when the issue first time moved from To Do until it entered last time in Done. For that, use function DateDiffDays():
DateDiffDays(
  ([Measures].[Transition from status first date],
   [Transition Status].[To Do]),
  ([Measures].[Transition to status last date],
   [Transition Status].[Done])
)
Set decimal formatting. Add the measure(measures) in the report.
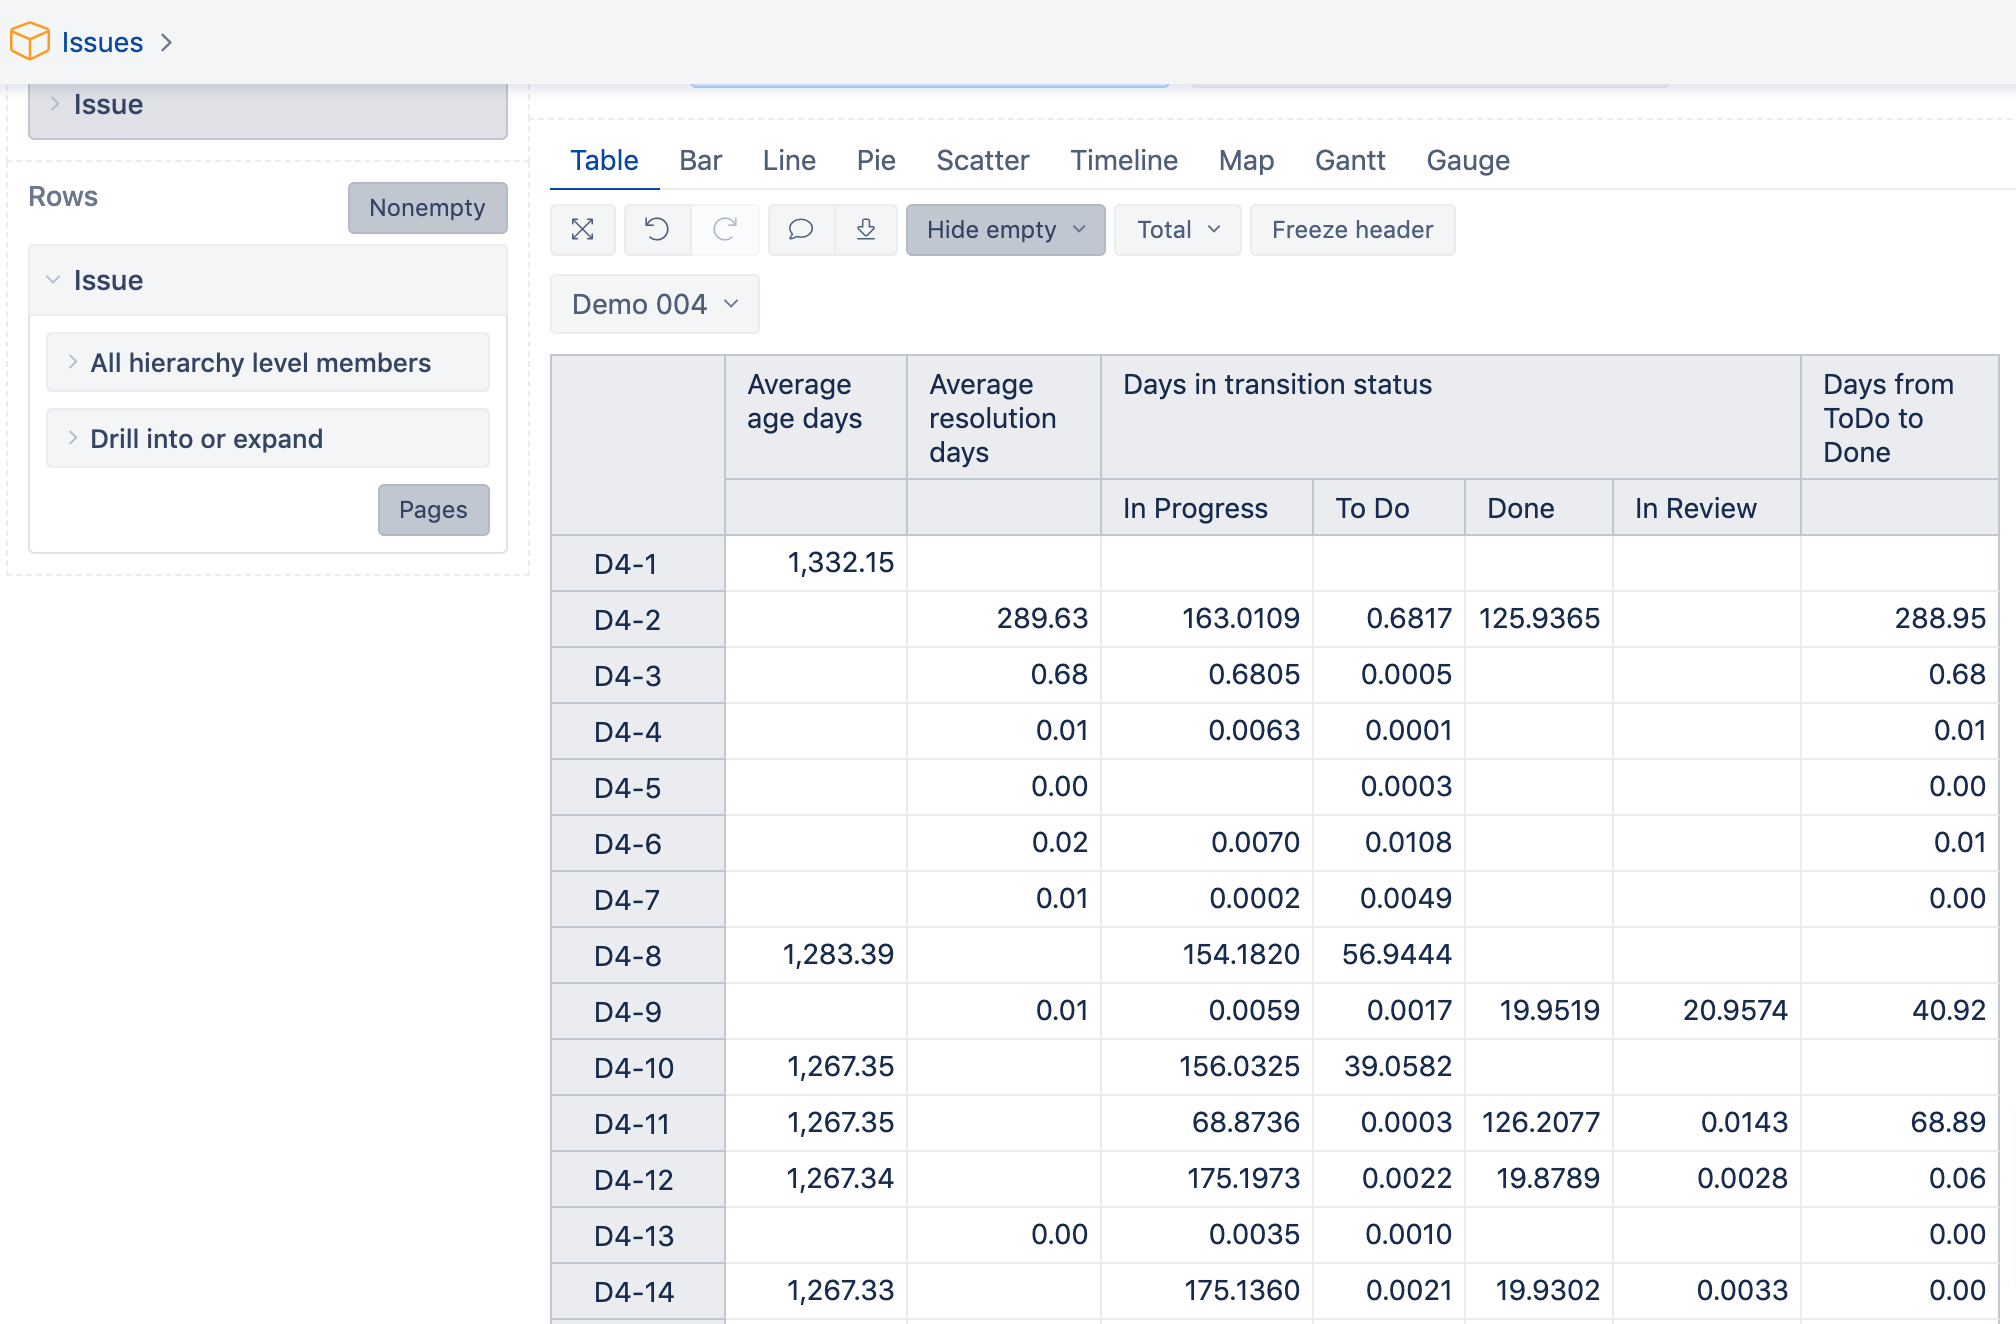
The report could look the following:
Best,
Ilze / support@eazybi.com