I was wondering if there is a way to create a heatmap for cell formatting that can compare data across all cells, instead of just within a row or column.
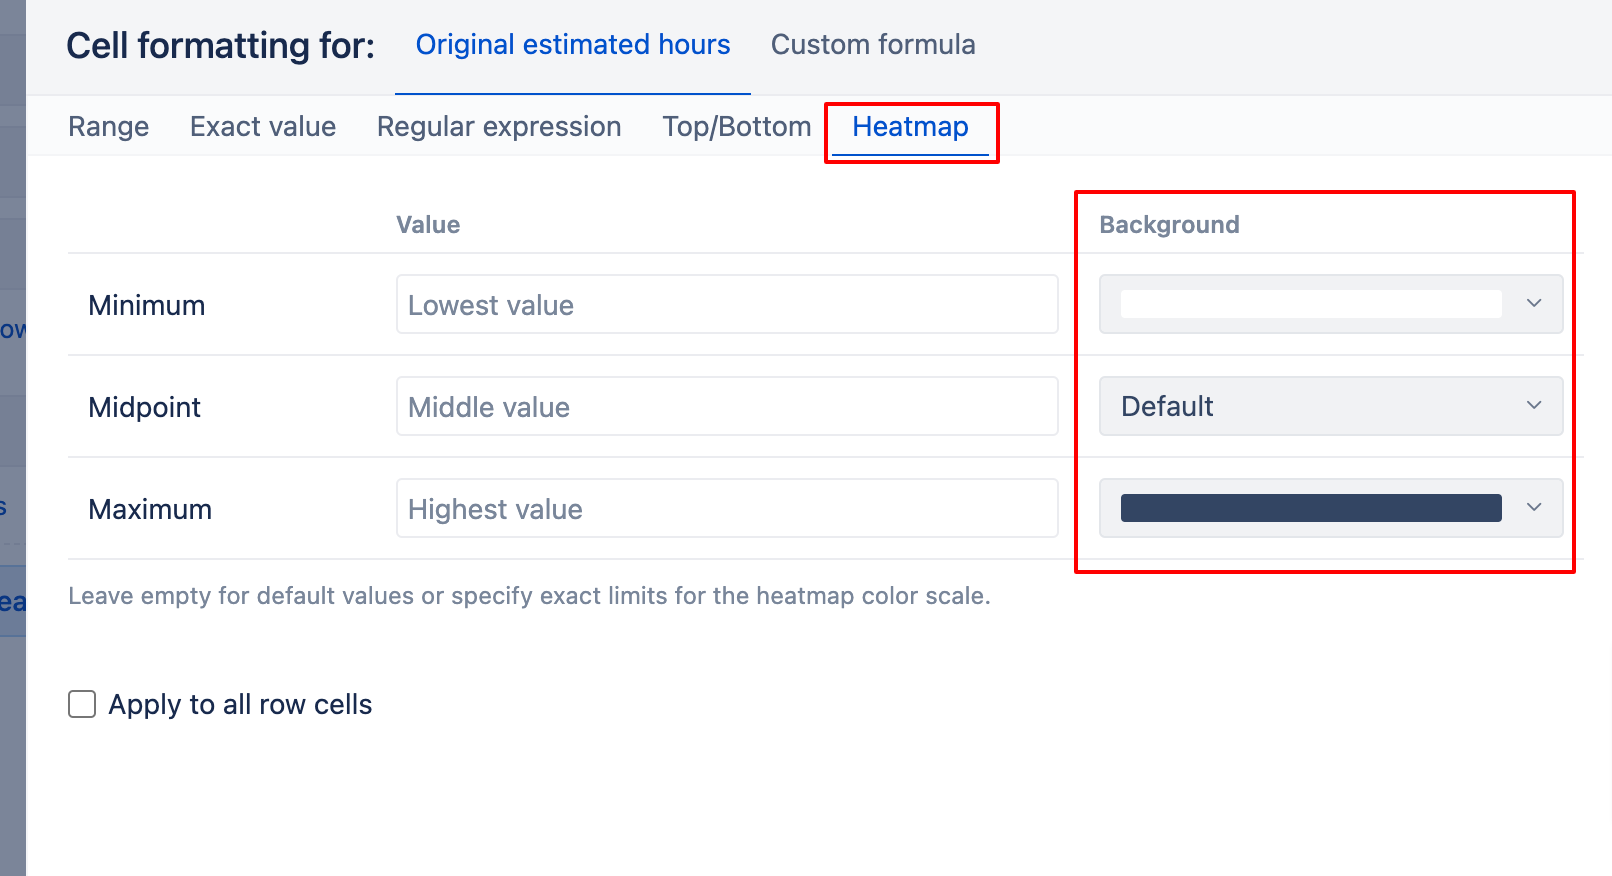
I suggest using the Heatmap condition instead of applying Range manually. Make sure you apply condition formatting at the measure level (Origianl estimated hours).
Hi @Elita.Kalane, thanks for answer. Unfortunately, I didn’t find how to apply Heatmap for all cells in the table. Currently, I can apply it to a separate row or column, but I need to find Minimum, Midpoint and Maximum values across all data in the table
Hello @AlenaS
Did you apply the conditional formatting rule at the at the measure level (Original estimated hours) or did you apply them individually at the assignee level?