Hey EazyBi guys
Heatmaps would be cool in EazyBi.
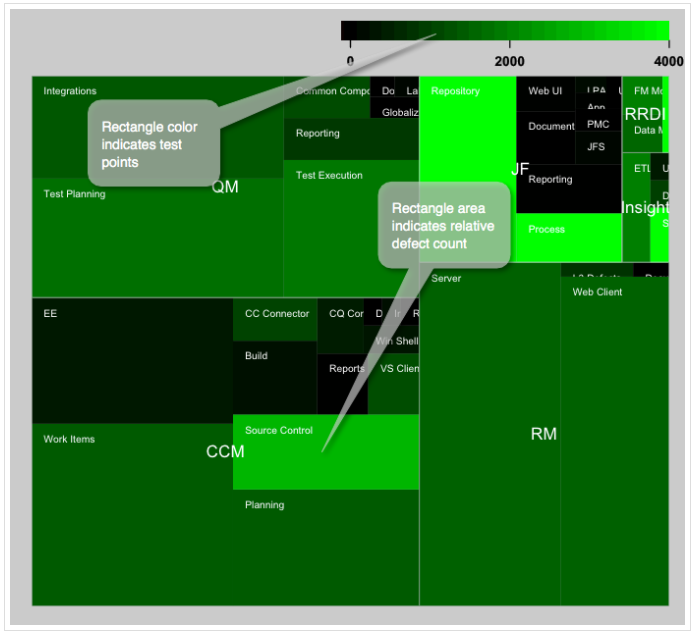
For example a graphical view showing defect count by Components (Jira project field), with bigger boxes for more defects, in a set time period.
Hey EazyBi guys
Heatmaps would be cool in EazyBi.
For example a graphical view showing defect count by Components (Jira project field), with bigger boxes for more defects, in a set time period.
Hi,
Heatmaps are now possible to implement using the advanced options of the Cell formatting.
Please, check the documentation: https://docs.eazybi.com/display/EAZYBI/Conditional+cell+formatting#Conditionalcellformatting-Heatmap
Here you can find an example report of how to create the heatmap:
Confluence - Confluence public demo - eazyBI
Kinldy,
Janis, eazyBI support