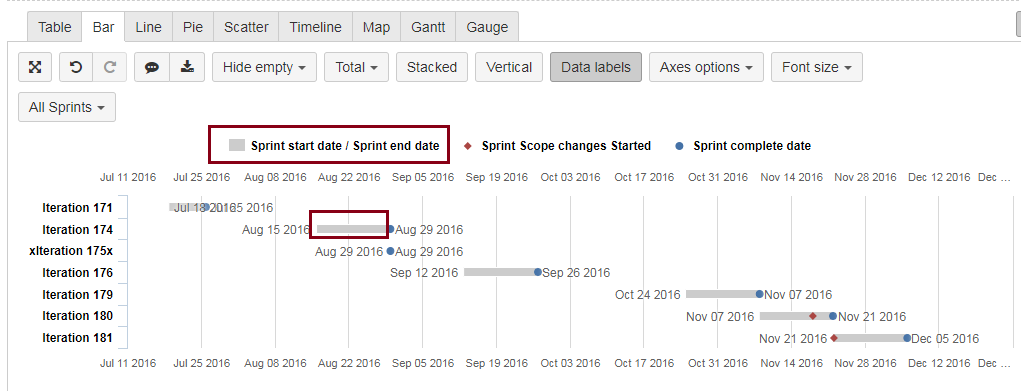
I found this really cool looking chart:
I can’t seem to find how the “Sprint Start date” & “Sprint End date” measures were combined to show the grey bar…any ideas?
Here’s a screenshot of specifically what I’m looking at:
I found this really cool looking chart:
I can’t seem to find how the “Sprint Start date” & “Sprint End date” measures were combined to show the grey bar…any ideas?
Here’s a screenshot of specifically what I’m looking at:
Hi jimbok11,
To achieve this chart type you need two date measures (as shown in the pic Sprint start date and Sprint end date) then follow below steps,
Please let me know if you need any additional information.thanks
That did it wonderfully, thanks @Ganesh! 


@Ganesh - follow-up…when I filter (using Custom fields), it doesn’t seem to reduce the Sprints shown (based on my filter criteria)…any idea when that’s the case?
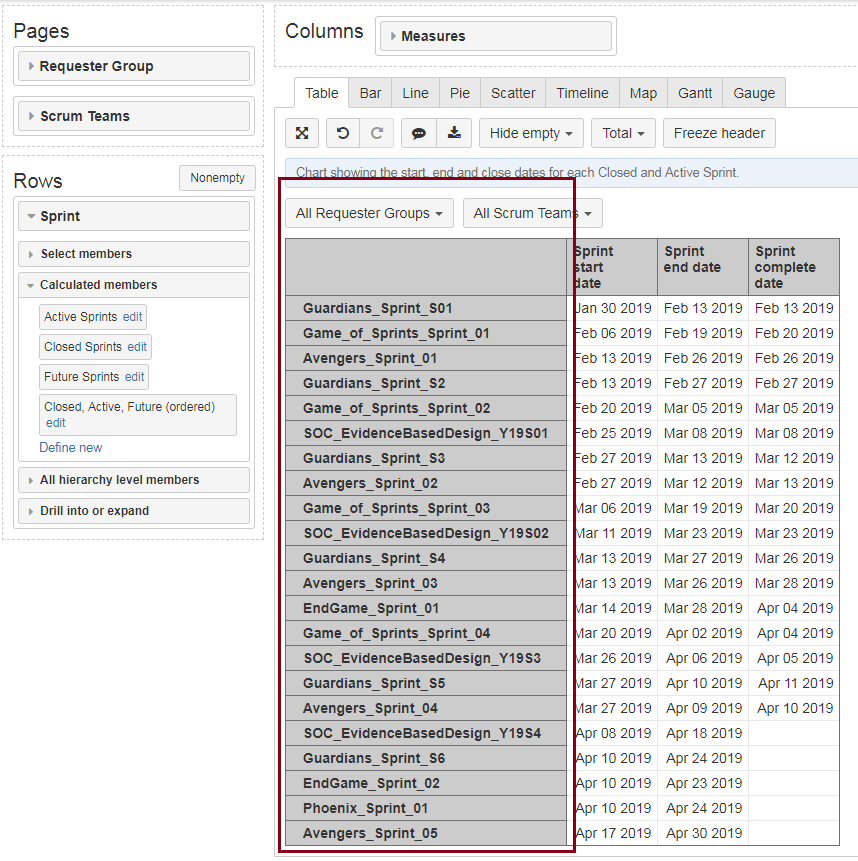
All selected:
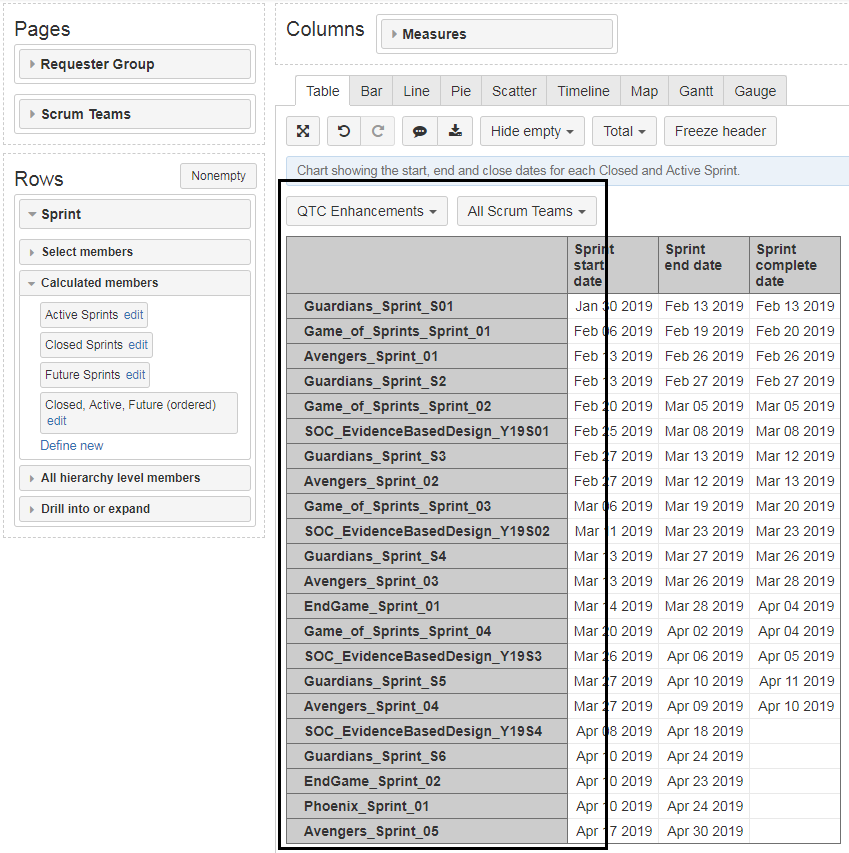
Filter selected:
Hello jimbok11,
Could you please elaborate your requirement ?
or else, Just place “Requester group” in “Rows” as well as “Pages” then try to filter it. Hope it help. please let me know if you need any additional information’s. thanks
Steps to Place “Requester group” in rows and pages ;
Thanks @Ganesh - unfortunately, I’m not on a version of eazyBI that allows me to add a dimension on both rows & page 
In terms of the requirement, the Requester Group (and Scrum Team) is a custom field on the Issue. When I have other reports that had similar column/rows (e.g. Sprint Velocity), the filters work fine 
I’m assuming because none of my column/rows have any data relating to Issues, these filters don’t work since Sprint data is not linked.
Yes, you are correct! To make the page filter work add Sprint scope measure which have value for all sprints, for example Sprint Issues committed (Jira Software custom fields).
Best,
Zane / support@eazyBI.com