I could really use some help from the wise BI gods out there.
I am attempting to build a report that tracks our adherence to bug SLA’s. Each Priority is named P0-P5, and each priority has it’s own SLA. SLA’s are calculated by measuring the difference between the create date and the resolved date. Example: P0’s must be resolved in less than 72 hours, and P3’s must be resolved in less than 90 days. I have already created by resolution intervals to match the SLA’s.
I have Structure working with a formula column to label the SLA as met or breached and this is working great for live data. I am turning to EazyBI for my historical data.
The display to the user should be able to plot our progress with SLA compliance quarter over quarter.
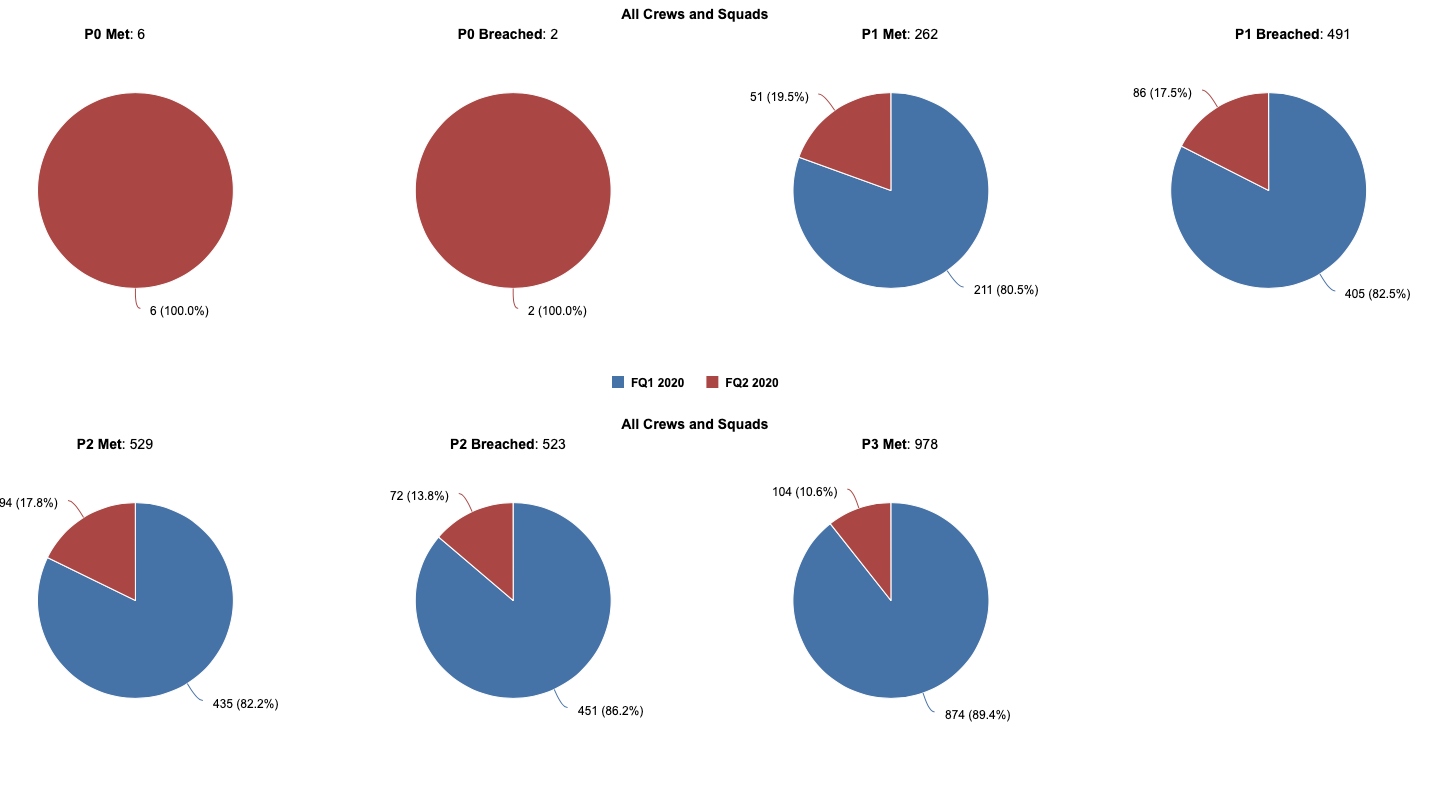
I have figured out how to create custom measures to calculate each of my met vs breached counts for each priority, but the resulting graphs are horrendous to look at. I either get way too many graphs like this:
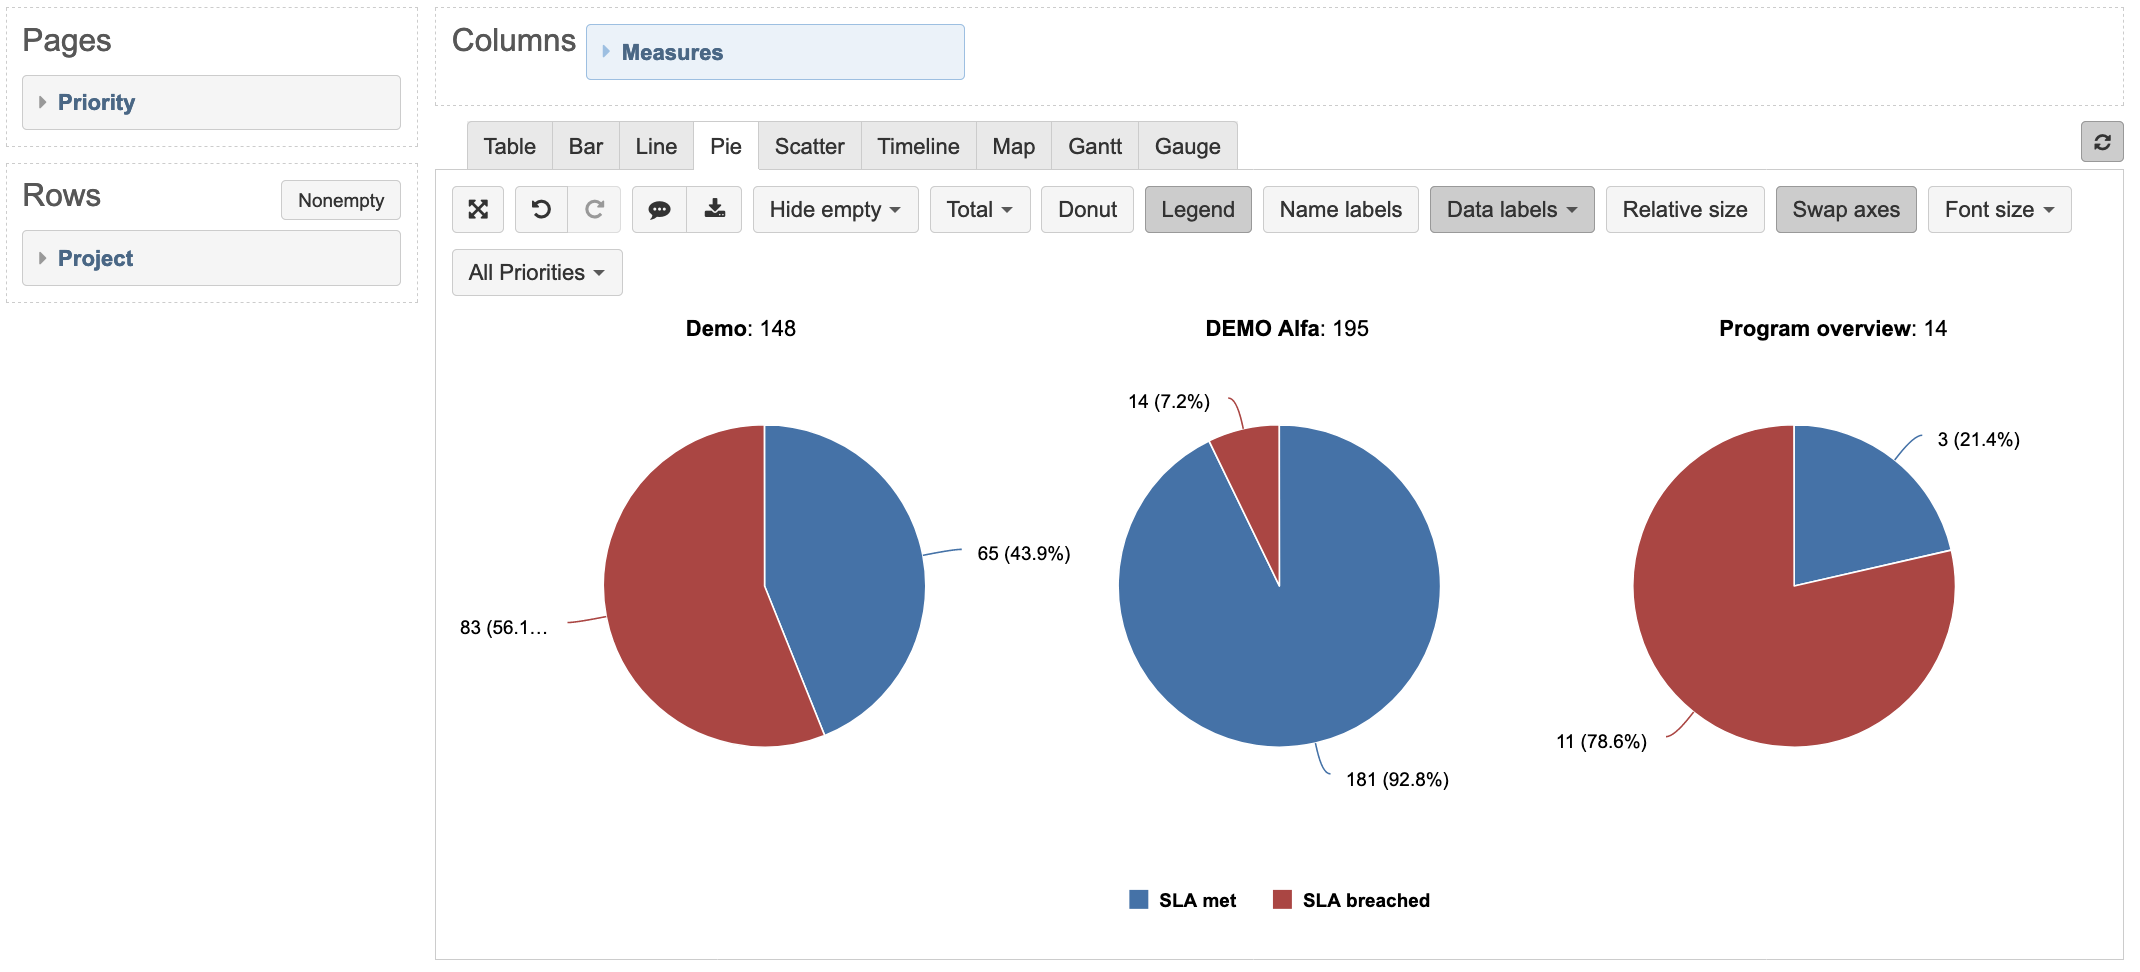
or the data is displayed in a misleading fashion like this:
This has led me to create separate reports for Met vs Breached on each Priority.
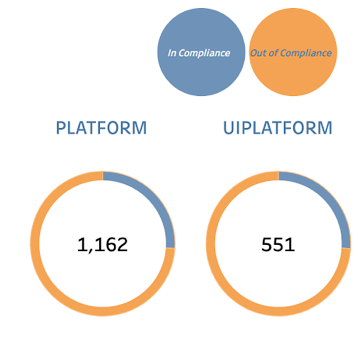
Our Data Warehouse team has showcased a solution where they have one single graph that displays an aggregate view of all SLA’s in compliance or out of compliance, stripping away all the priorities, but still allowing you to click on the graph and drill through. I am trying to do the same thing in Jira to avoid depending on an integration and an outside team for modifications. Their solution looks like this:
Does anyone have any hints on a direction I should be looking to mirror the Data Warehouse setup in eazybi?
You can define two measures one for Met and another one for Breached. You can sum all met or breached issues there and then use only those two measures in reports.
Here is my example, where I mentioned two Priorities Highest and High, and any other. I addressed a metric designed for any of them. You can use the formula of the SLA calculation of priority directly in the formula as well:
SUM(
Generate(
    { [Priority].CurrentMember,
    ChildrenSet([Priority].CurrentMember) },
    Descendants([Priority].CurrentMember,[Priority].[Priority])),
  -- set count issues matching rules for each priority
  CASE [Priority].CurrentMember.Name
  WHEN "Highest" THEN [Measures].[Highest - met]
  WHEN "High" THEN [Measures].[High - met]
  ELSE [Measures].[other - met]
  END
)
The measures will work with priority selection in the case, you would like to see met/breached values per priority as well.
Daina / support@eazybi.com
Thank you for the reply! This is on a JSW project, so we do not have actual SLA’s, but rather are calculating met or unmet through eazyBI itself. This is what my current calculated measure for “Met” looks like, however if I select a priority like “P1” in pages, then I get no results since the current member doesn’t match any cases in that configuration.
CASE [Priority].CurrentHierarchy.CurrentMember.Name
WHEN "P0"
THEN
NonZero(SUM(
  Except(
    [age interval].[age interval].Members,
    {
    [age interval].[(none)],
    [age interval].[04 - 05],
    [age interval].[06 - 30],
    [age interval].[31 - 90],
    [age interval].[91 - ...]
    }
  ),
  Aggregate (
{
[Issue Type].[Bug],
[Issue Type].[Escalation]
},
  (
  [Measures].[Open issues],
  [Priority].[P0]
  )
)))
WHEN "P1"
THEN
NonZero(SUM(
  Except(
    [age interval].[age interval].Members,
    {
    [age interval].[(none)],
    [age interval].[06 - 30],
    [age interval].[31 - 90],
    [age interval].[91 - ...]
    }
  ),
  Aggregate (
{
[Issue Type].[Bug],
[Issue Type].[Escalation]
},
  (
  [Measures].[Open issues],
  [Priority].[P1]
  )
)))
WHEN "P2"
THEN
NonZero(SUM(
  Except(
    [Age interval].[Age interval].Members,
    {
    [Age interval].[(none)],
    [Age interval].[31 - 90],
    [Age interval].[91 - ...]
    }
  ),
  Aggregate (
{
[Issue Type].[Bug],
[Issue Type].[Escalation]
},
  (
  [Measures].[Open issues],
  [Priority].[P2]
  )
)))
WHEN "P3"
THEN
NonZero(SUM(
  Except(
    [Age interval].[Age interval].Members,
    {
    [Age interval].[(none)],
    [Age interval].[91 - ...]
    }
  ),
  Aggregate (
{
[Issue Type].[Bug],
[Issue Type].[Escalation]
},
  (
  [Measures].[Open issues],
  [Priority].[P3]
  )
)))
END
I used your formula with my priority names and it worked as expected for me if I used a single priority selection in Pages.
CASE ... with [Priority].CurrentMember.Name will check the exact name of the priority you are using in the report, for example, on Pages. The formula should have a case to match the priority name exactly. Please check the spelling in the formula (case sensitive names of priorities you are using for a selection).
If you have problems with multiple priorities in Pages (or All Priorities selection), you would like to add the aggregation part as well:
SUM(
Generate(
    { [Priority].CurrentMember,
    CascadingChildrenSet([Priority].CurrentMember) },
    Descendants([Priority].CurrentMember,[Priority].[Priority])),
  -- set count issues matching rules for each priority
/* you formula goes here */
)
The formula with this aggregation part will go down to priority member names (priority names used in Jira). If you are using calculated members for P0, P1, etc., please use default priority member names in case when … calculation.
Daina / support@eazybi.com