This is more of a cosmetic issue from a Newbie.
We will be using eazyBI in JIRA-Cloud to publish several reports & dashboards on Atlassian Confluence.
We get the exact data-results we are looking for, but was wondering if there is a way to alter how the table / report is displayed, in a way that would be effective for the audiences using Confluence.
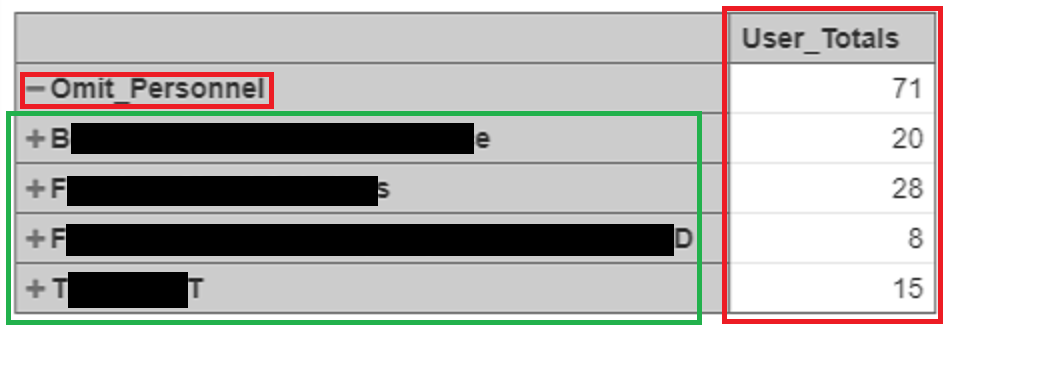
1) "Omit_Personnel"
This item in red square is a Calculated Member row /title under Projects as you can see, that give me valid results.
Is there a way to “hide” the header / title “Omit_Personnel” and only show the result sub-headers?
2) "User_Totals"
This User-Defined Calculated member column gives be the data I need by additionally using the “Hide empty rows” feature simultaneously, so I am left with the 4 results you see here.
Is there a way to come up with the same results, but to HIDE the this column “User_Totals” altogether?
Conclusion
Essentially, what would be ideal for this, and many other dashboards that we need from eazyBI would be what you see within the “green” box in the image.
I’m hoping this is possible with the easyBI product, as so far it has been producing all the information we need and has been great!