Hi EazyBI Community,
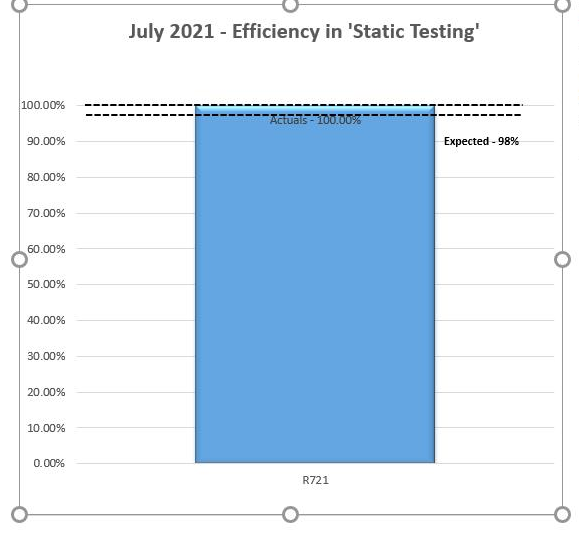
We are trying to replicate this graph with a horizonal dash line at 98%:
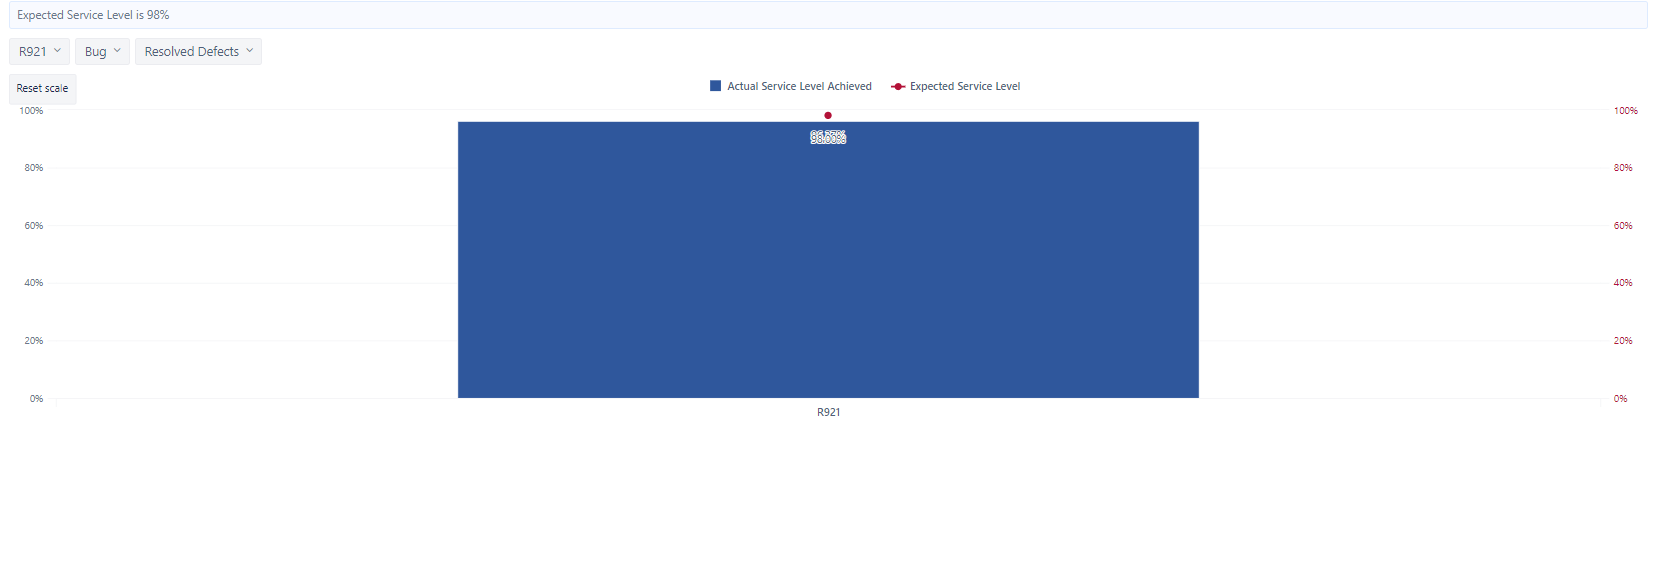
This is what we have so far, using a different type (line) with a different axis.
Let us know if there is a solution.
Thanks.
When there is one bar in the, the line can not be plotted in the chart, only a scatter point (two points are needed to draw a line)
In such cases, you may use both values as bars instead of the threshold line.
Best,
Ilze, support@eazybi.com