HI all:
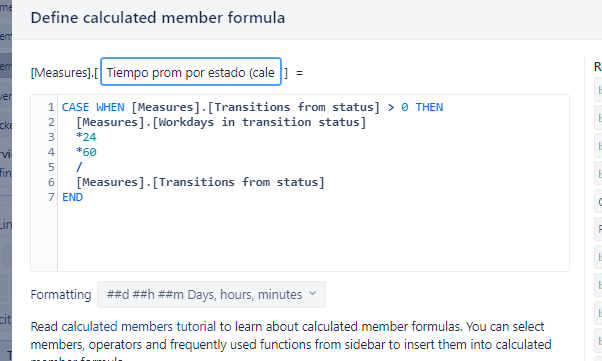
I have defined a customized calculated member for the average workdays in a status because I wanted to show it in duration format:
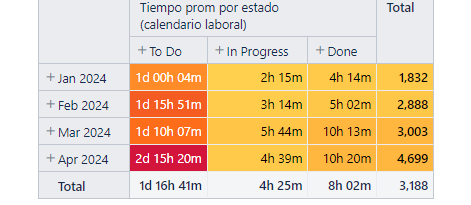
The problem is that when I want to show the total row or column, it displays in decimal and I couldn’t find a way to change it to a duration format.
Any ideas?
Thanks,
W.
Hi, @walterdp
Welcom to the eazyBI community.
Unfortunately, this behavior of the total is a known bug in eazyBI. Currently, I can’t give you a workaround to resolve this issue. We will let you know once the bug is resolved. I apologize for the trouble this is causing you.
Kindly,
Ilze
Hi walterdp,
It seems that you are using [Transition Status.Category] in your report.
Until the bug with total formatting is fixed, there are two options for workaround:
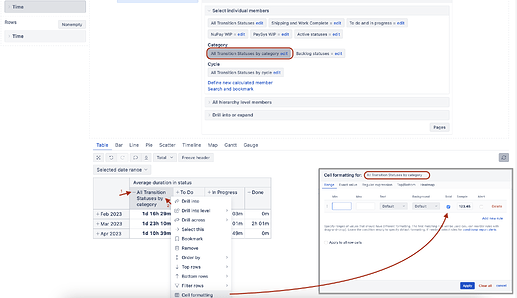
(A) Select the member “All Transition Statuses by Category” in Transition Status dimension and expand it. Then click on “All Transition Statuses by Category” header in the table, choose Cell formatting and select to show values in bold.
It will be shown as the first column before the expanded statuses though and that can not be changed.
(B) If you must have the Total column as the last column, then you need to create a new calculation and do the following steps (sequence of actions is important):
- Remove the dimension “Transition Status” from the columns.
- Create a new Total calculation using default Transition Status dimension member in tuple with your existing measure. Apply duration formatting to this calculated measure.
([Measures].[Tiempo prom por estado (calendario laboral)],
[Transition Status].CurrentHierarchy.DefaultMember)
- Click on your original measure column “Tiempo prom por estado (calendario laboral)” header and drill into “Transition Status.Category” >> Category.
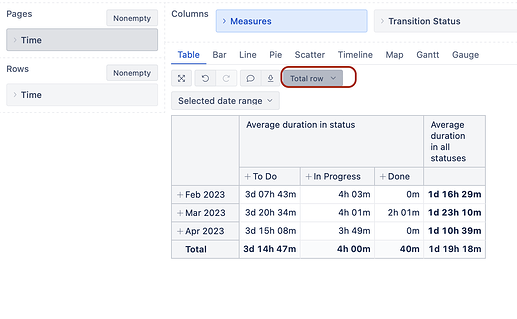
- In the Table results bar, select to show Total only for rows. The final result would look like this:
I hope this helps!
Kindly,
Ilze
1 Like
Hi @ilze.krauze !
Thanks! It seems it worked! As I have removed some of the statuses I would like the Total duración promedio to show the addition of only those columns and not the totality of the columns 
Before removing columns
After
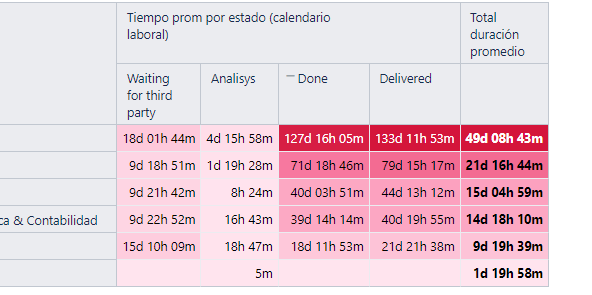
Thanks!
Hi walterdp,
You would have to create a calculated member in Transition status dimension,
that includes only the needed statuses, for example:
Aggregate({
[Transition Status].[Waiting for third party],
[Transition Status].[Analisys],
[Transition Status].[Delivered],
[Transition Status].[On hold]
})
and then use that new aggregated member name in the formula for Total:
([Measures].[Tiempo prom por estado (calendario laboral)],
[Transition Status].[NEW AGGREGATED MEMBER NAME])
You can also use that member to show only the selected the list of transition statuses in the columns.
Best,
Ilze
1 Like
Hello @walterdp,
I wanted to inform you that eazyBI version 8.1 has been released with a fix for the total columns formatting issue you reported. The total rows should now correctly display duration values in “##d ##h ##m” format instead of showing raw number sums.
Please see the complete changelog here: Changelog - eazyBI for Jira
best,
Gerda // support@eazybi.com
1 Like


