The problem when I use the measure “Open issues” is if one of the issues close today, this issue dissapear and decrease the number of issues on the previous days. The chart is done daily so we can’t modify the issues on the previous days, but this measure modify the chart.
I wanted to add that Open issues gives the number of unresolved issues at the end of the corresponding Time dimension period. This means that if the issue is created on Aug 1 and resolved on Aug 4, it will show as open for Aug 1, Aug 2, and Aug 3.
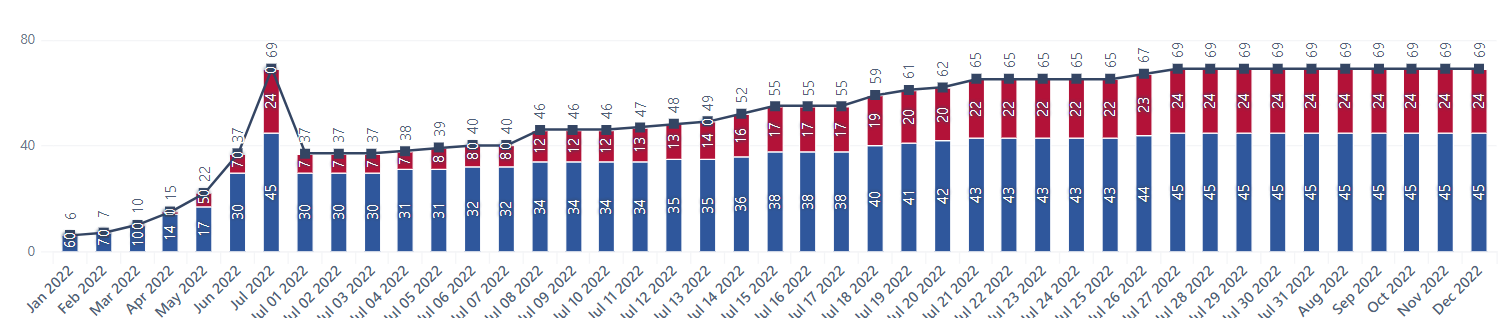
I am unsure how you are stacking the issues from the screenshot, but maybe you are looking for issue status history. Please look at this demo report Unresolved issues by statuses over time - Issues - Jira Demo - eazyBI. While it shows the unresolved issue statuses over time, you can remove the resolution filter from Pages and see all issue statuses over time.