How can I see a diagram of what story I was progressing at at any point in time?

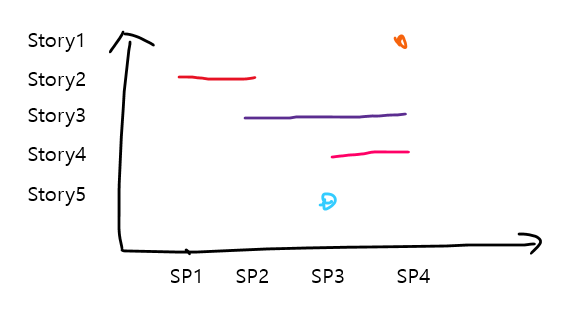
I’m trying to make a chart that shows what kind of story was going on at any point in time.
Here’s a picture of what I want:
image

The Story issue type has a specific link relationship with the task, so a Story dimension is created and used in the Advanced settings.

[jira.customfield_Story]
name = “Story”
inward_link = “is child of”
issue_type = “Story”
update_from_issue_key = “parent_issue_key”
dimension = true

If the task worked even for 1h in that sprint, how can I make a diagram like the one above when defining that the parent story progressed in that sprint?
Help.

Hi @bluesky

The “Hours spent” measure should contain all the hours spent by the Stories and their children mapped to the respective Sprints that they were logged in.
You can use this measure together with the Sprint dimension in Columns and the Story dimension in Rows to show a chart of spent hours over several sprints.
I’m using the “Epic link” dimension in my example, but if you have correctly set up the issue link, it should work the same for you:

​Best regards,
​Nauris / eazyBI support