Hi @bluesky
The “Hours spent” measure should contain all the hours spent by the Stories and their children mapped to the respective Sprints that they were logged in.
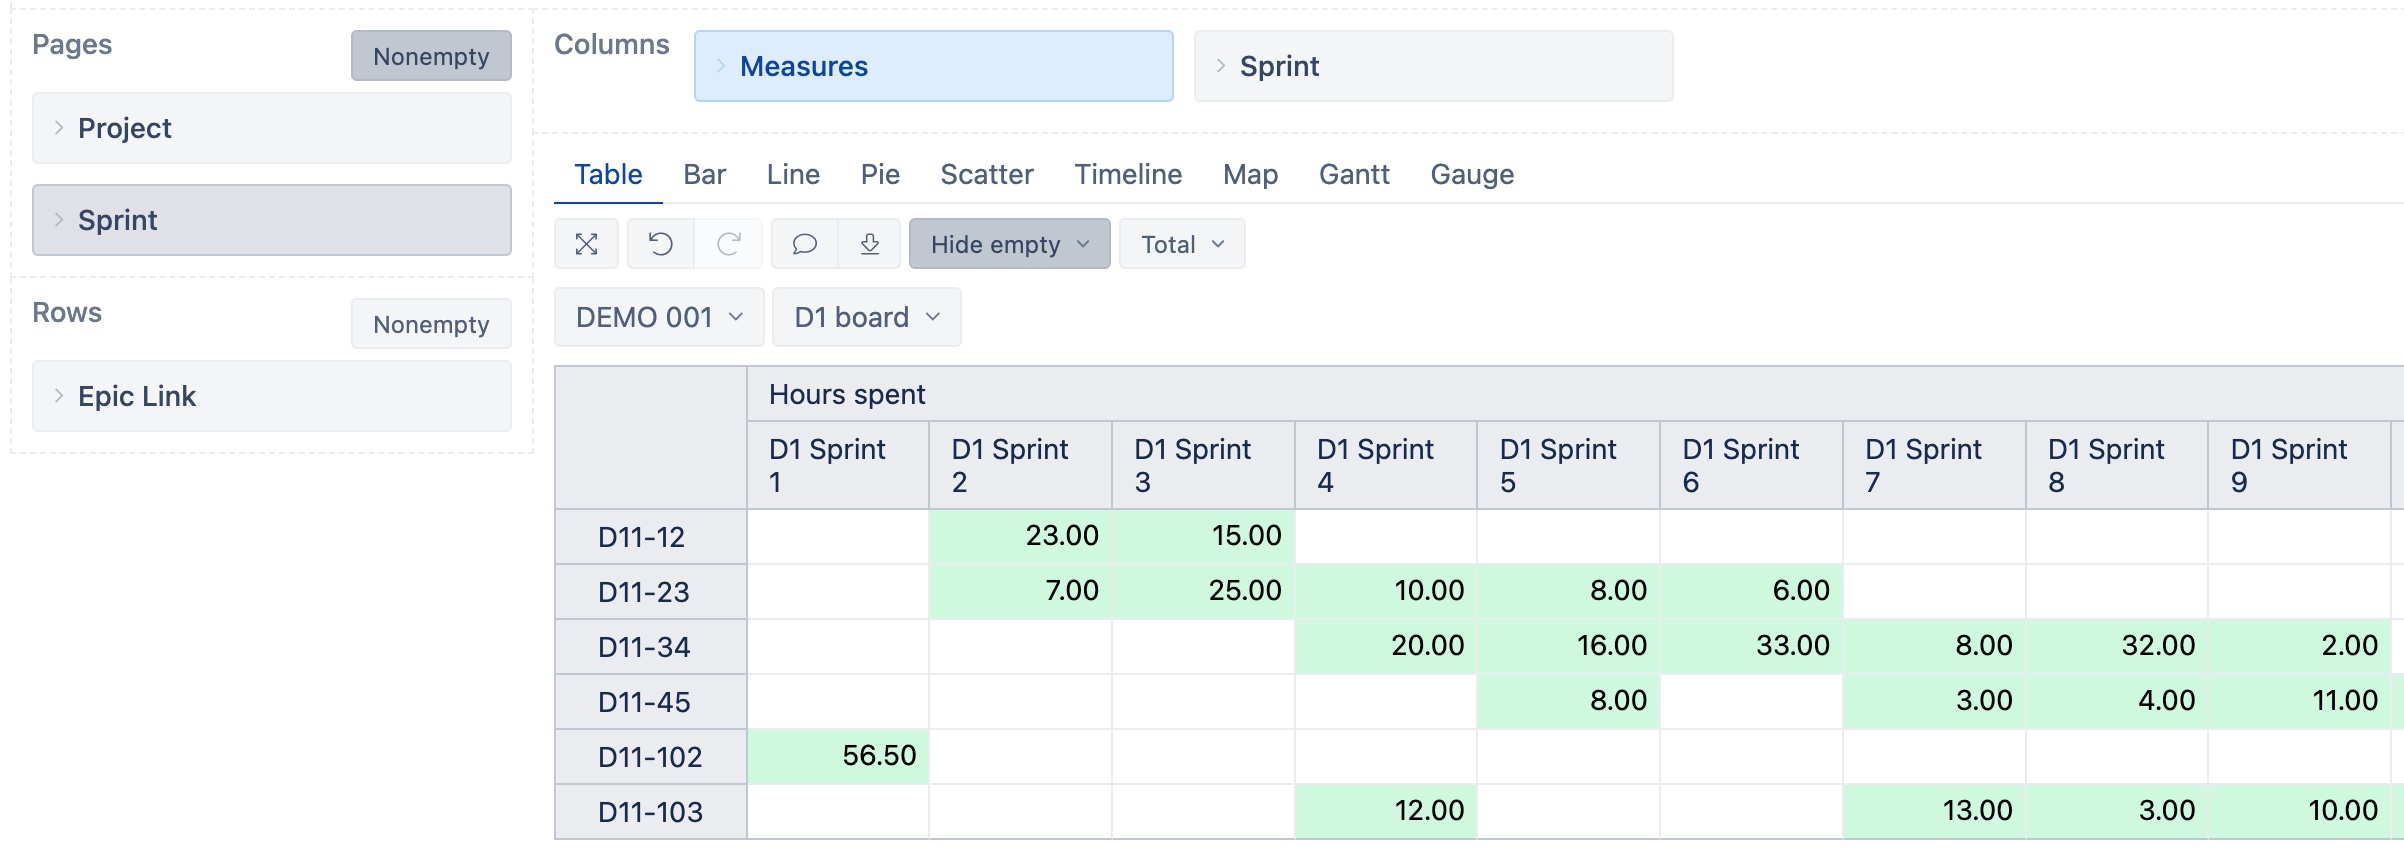
You can use this measure together with the Sprint dimension in Columns and the Story dimension in Rows to show a chart of spent hours over several sprints.
I’m using the “Epic link” dimension in my example, but if you have correctly set up the issue link, it should work the same for you:
Best regards,
Nauris / eazyBI support