I am trying to craft a new report to visualize withn a Time Dimension: All tickets that have reopens in order to fetch lastly some metrics about, for example: avg or repons, sum, etc.
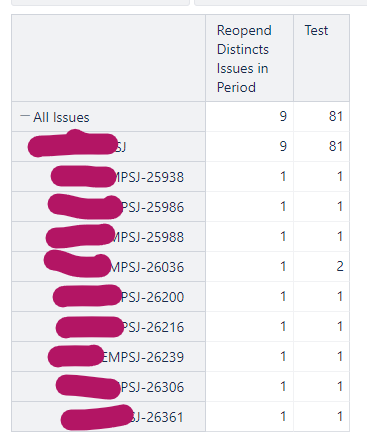
You can see on my first approach that I could get firtly (1st column) all distincts ticket with reopens but, when trying to calculate the amount of reopens by period and as sum for parent levels I am not able to find the correct result.
See below the first approach and calculation.
--annotations.total=sum
CASE WHEN
[Issue].CurrentHierarchyMember.Level.Name = "Project" OR
[Issue].CurrentHierarchyMember.Level.Name = "All Issues" AND
DateInPeriod(
[Measures].[Issue resolution date],
[Time].CurrentHierarchyMember)
THEN
NonZero(sum(
Filter(Descendants([Issue].CurrentMember,[Issue].[Issue]),
[Issue].CurrentHierarchyMember.get('Reopened')>0
AND
DateInPeriod(
[Measures].[Issue resolution date],
[Time].CurrentHierarchyMember)
),
[Measures].[Reopened resolved]
))
ELSE
[Issue].CurrentHierarchyMember.get('Reopened')
END
I guess, as I am very new on these, I am mixing up concepts. I try settostr function and found that nested tickets are considering till the last leaves linked issues and that could be the reason why so, please I need help from some more experimented user here to guide me or gave some clue.
I.e., when applying to settostr to the filter I found that when the issue has one or more linked issues they are also tracking under the iteration and that is the reason, I guess, from wich the top level: Project or All Issues summarized 81 but also the same occurs with the individual issues where if reopen for individual issue is 1 and the nested is 1 it sums up 2.
I would like to see on Test columns:
for each individual issue the value of [Issue].CurrentHierarchyMember.get(‘Reopened’) : 0…n reopens and for the top level: default or project the summarization of the individual issues shown below for the time dismension selected.
Hi,
I keep on working with it and found some conceptual issues in my previous work. My last try is like follows:
--annotations.total=sum
CASE WHEN
(
[Issue].CurrentHierarchyMember.Level.Name = "Project" OR
[Issue].CurrentHierarchyMember.Level.Name = "(All)"
)
THEN
-- True
sum( Filter([Issue].CurrentMember,
[Issue].CurrentHierarchyMember.get('Reopened')>0
AND
DateInPeriod(
[Measures].[Issue resolution date],
[Time].CurrentHierarchyMember)
),
[Measures].[Reopened resolved]
) -- end sum
ELSE
-- False
[Issue].CurrentHierarchyMember.get('Reopened')
END
Now the only issue is that the summarized block when level is project or (all) does not show the sum of all inidividuals below.and if I troubleshoot this block it works ok alone; i.e, for example if I replace it with a constant, it shows the constant but if I left the sum(filter)_block it is not calculated…
The measure “Reopened resolved” should show you the number of times each individual issue reopened and also sum up the values to higher levels, like “All Issues” and Project members.
Or is this not your goal?
Would you like to show the number of reopens in the higher levels or the count of issues where the reopens happened at least once?
Could you please tell me what exactly you would like to show for the individual issues and what value you would like to show for upper levels (All Issues, Projects, etc.)?
I feel like I’m missing the main requirement without understanding what exact values you would like to show for each level.
I need to craft a report showing metrics in relationship to reopens as main metric of quality so, I want to show:
all distinct tickets that had at least one reopen within the time dimension period
all accrual reopens in period
% of reopens over total tickets created in period
The report should be flexible enough to show the right numbers not only when looking at inidividual issues but also when looking at default category /all issue memebers at the top of the column, you know. but always just oncisdering the ones that fall into the time period dimension you have selected on pages.
In the third metric you wish to calculate the % of reopens over total tickets created in the period, does this mean that the first two metrics should also look at issues reopened, that are created in this same period?
You’re right! The idea is retrieving metrics of reopened within a time dimension so we can reflect some kind of quality assurance perfomance and opportunities to improve in that way.
But should the time interval apply to the creation date?
For example, show the number of reopened tickets, that were created in Aug 2024.
Or show the number of reopened tickets that were reopened in Aug 2024, no matter when they were created?
IT should be applied to the reopened date in period, as we want to measure the impact of reopens in such a period. I.e., at least so far, we are not worried about aging but we want to focus on quality in period (later we will ).