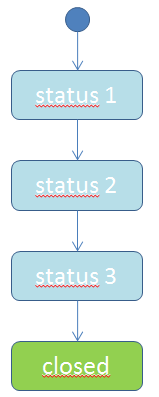
Hello team, there must be a simple question for you. I need a report where you can see: How many average days do the Issues take between 2 statuses?
For example: Status 1 to status 3, all Issues need 20 days from status 1 to status 3.
best regards
Mario

Mario,
One solution for this use case would be to create a calculated member in the Transition status dimension and make an adjusted version of the “Average days in transition status” standard measure to aggregate the time spent for several statuses.
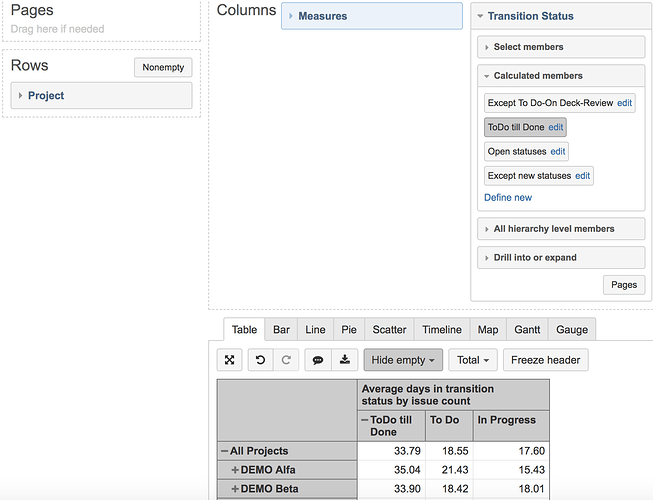
I created an example report to aggregate statuses To Do and In Progress with the following steps. First, create the aggregated member in the Transition status aggregating the needed statuses (“ToDo till Done”):
Aggregate({
  [Transition Status].[To Do],
  [Transition Status].[In Progress]
})
Now the adjusted version of the measure would look the following (“Average days in transition status by issue count”):
CASE WHEN [Measures].[Transitions from status] > 0 THEN
  [Measures].[Days in transition status] /
  [Measures].[Transitions from status issues count]
END
The idea is that Days in transition status counts the total number of the Days spent for the aggregated status, and divide it by the distinct count of the issues having transitions through any of the aggregated statuses.
Please, find the example report below:
Kindly,
Janis, eazyBI support
Hello Janis,
Can you explain me how to calculate the time between 2 of more transition status? Is there a difference to use this [Transition].[Backlog => In progress]
and this
[Transition Status].[Backlog],
[Transition Status].[In progress]
best regards
Michiel
Hi guys!
How to do the same thing, but now get the average resolution time for these aggregated statuses?

