I’ve now resolved that problem. I’m working on a new calculation, could you help have a look?
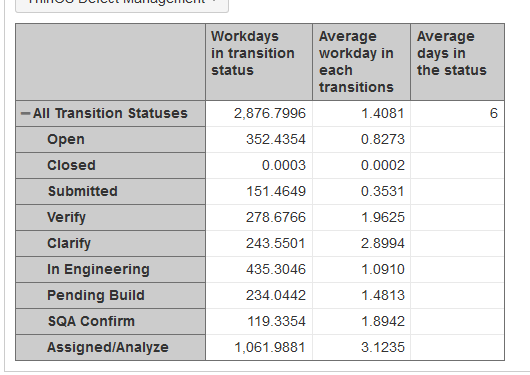
See screen shot below, I’m trying to calculate that, on average, how many days were spent in each of the transition status. For e.g. on average, how many days were cost in “Clarify” status, for all issues that have reached this status.
I tried to use below calculation but it is not working… Please kindly help. Thanks!
case when [Measures].[Issues created]>0 THEN
[Measures].[Workdays in transition status]/[Measures].[Issues created]
Measure Average workdays in transition status represent an average time for each transition. But to count how much time on average one issue spent in each status regardless of how many time an issue has been in that status you might want to define a new calculated measure. In this case, your approach is correct to divide measure Workdays in transition status with issue count; to make it work as expected you should use measure Transitions from status issues count instead of Issues create:
CASE WHEN
  [Measures].[Transitions from status issues count]>0
THEN
  [Measures].[Workdays in transition status]
  / [Measures].[Transitions from status issues count]
END
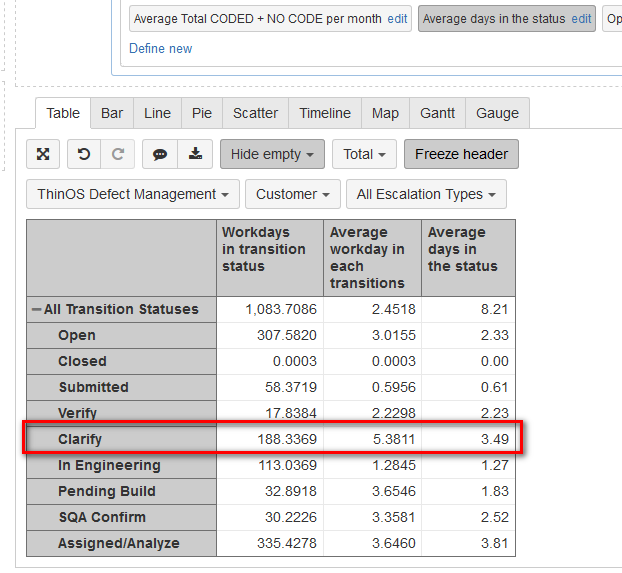
I used this calculation, but seems the results are not expected…
I used Transition Status in Row
I used Measures in Column
I created measure for average days in each transition status in below calculation
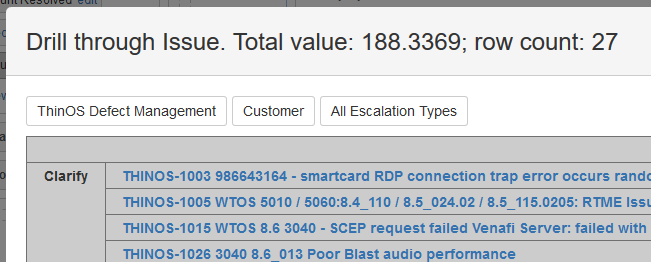
As you can see from screen shot, in transition status “Clarify”, the total workday in this transition status = 188.3369, the total issue count = 27, so the calculation result should be 188.3369/27 = 6.975
But the calculation of measure is now showing 3.49… almost 50%
Please kindly help to check… Thanks!
CASE WHEN
[Measures].[Transitions to status issues count]>0
THEN
[Measures].[Workdays in transition status]
/ [Measures].[Transitions to status issues count]
END
I figured this out. I should use “transition from status issue count”… not sure why but some “transition to status issue count” is 2 times of “from status issue count”
I got another one below, not sure if you could also help
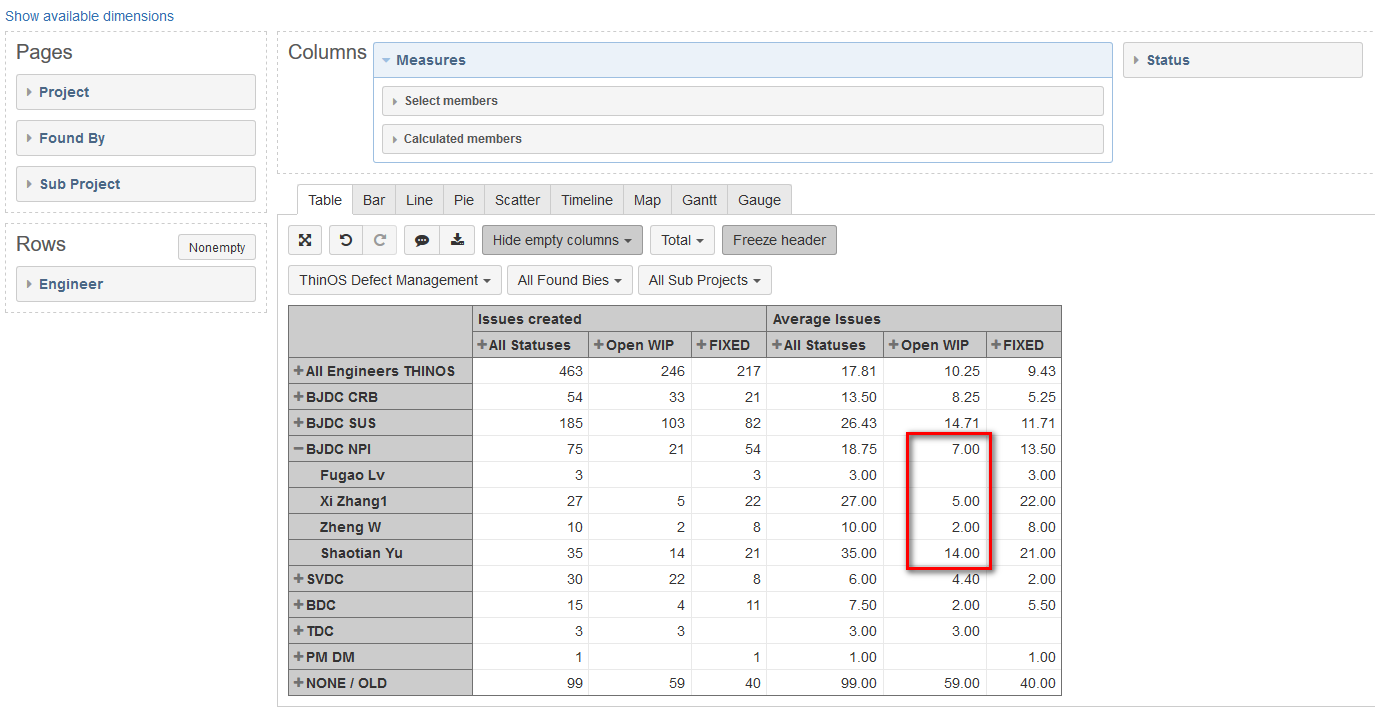
Basically we need to average issue on user count
I used Measure and Status in Colum
I used Engineer in Rows
I created calculation in Status to aggregate values between “WIP" and “fixed”
I created calculation in Engineer, to aggregate values between engineer groups
Lastly, I created “average issues” with below calculation – as you can see from the screen shot, this does not calculate correctly; when in a group some engineer has 0 issue linked with them – the average on the group is not correct.
Meanwhile the other data are correct. Please kindly help advise. Thanks!
@Leon, you figured it out correctly, in the calculation should be measure Transitions from status issues count. Thank you for noticing that! I fixed the formula in my answer.
We keep one topic in one thread to allow users search for solutions and keep Community topics in order, If you have a new question which is not directly related to the current topic, please post it as a new topic.