Hi,
I was wondering how do I created a secondary Y axis ? The sample report Created vs resolved issues over time displays exatly what I’m trying to do
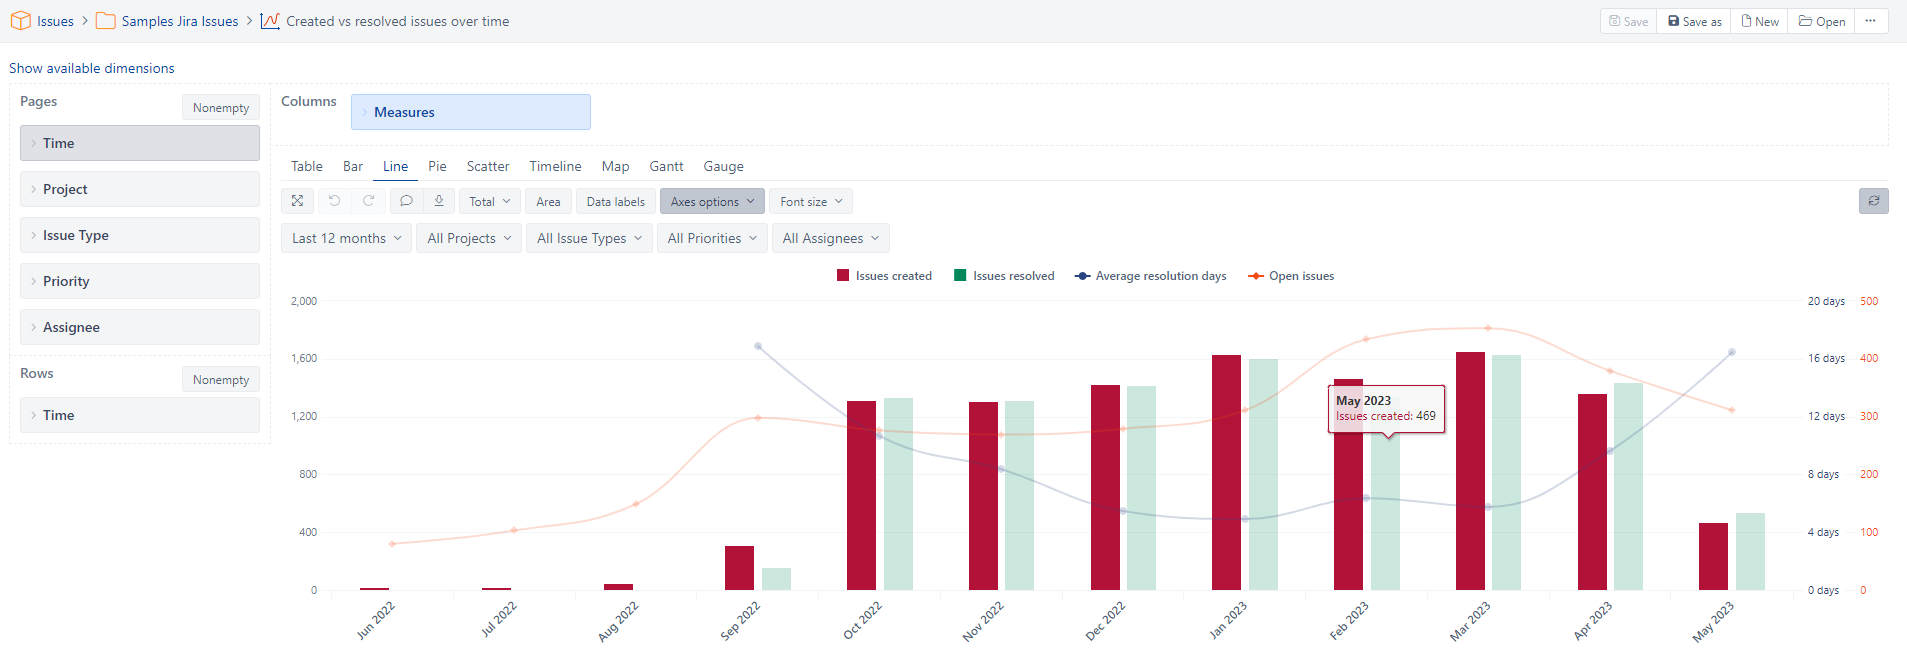
How do I reproduce this for Line charts ?
Thank you
Hi,
I was wondering how do I created a secondary Y axis ? The sample report Created vs resolved issues over time displays exatly what I’m trying to do
How do I reproduce this for Line charts ?
Thank you
Click on the specific item in your legend, and a menu will come up.
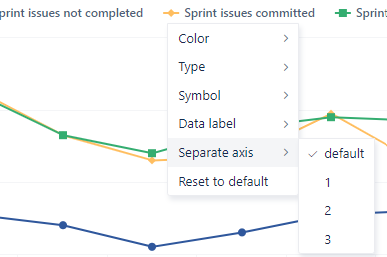
Go to the menu option titled “Separate axis,” and then select the 1. That should switch the axis for the item you chose.
Hi Magnum,
Awesome, that was easy.
Thank you very much