Hi,
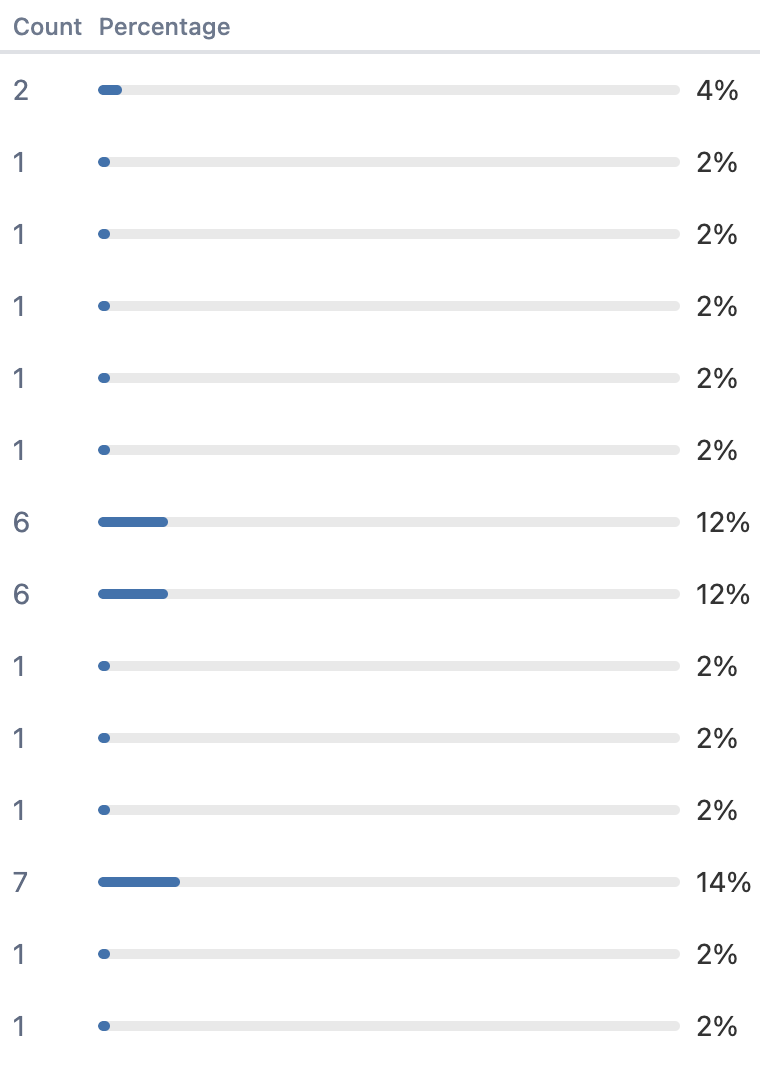
I am trying to create a report where I wish to see monthly growth/change in the count and the same should be reflected in the Percentage Progress bar. Kindly refer to the attached screenshot and help me with detailed steps to create it. Here count is the link to JIRA Issues.
You can create a report like this by using the “Stacked” and “Percentage” option in the Bar chart type.
Use two measures- one to represent the amount of finished progress and the other to represent the unfinished progress, so they could be stacked together to make 100% of possible progress.
You can check out this sample report that uses these options for the Bar chart: Project progress % - Issues - Jira Demo - eazyBI
With a couple of tweaks, the report can look like this:
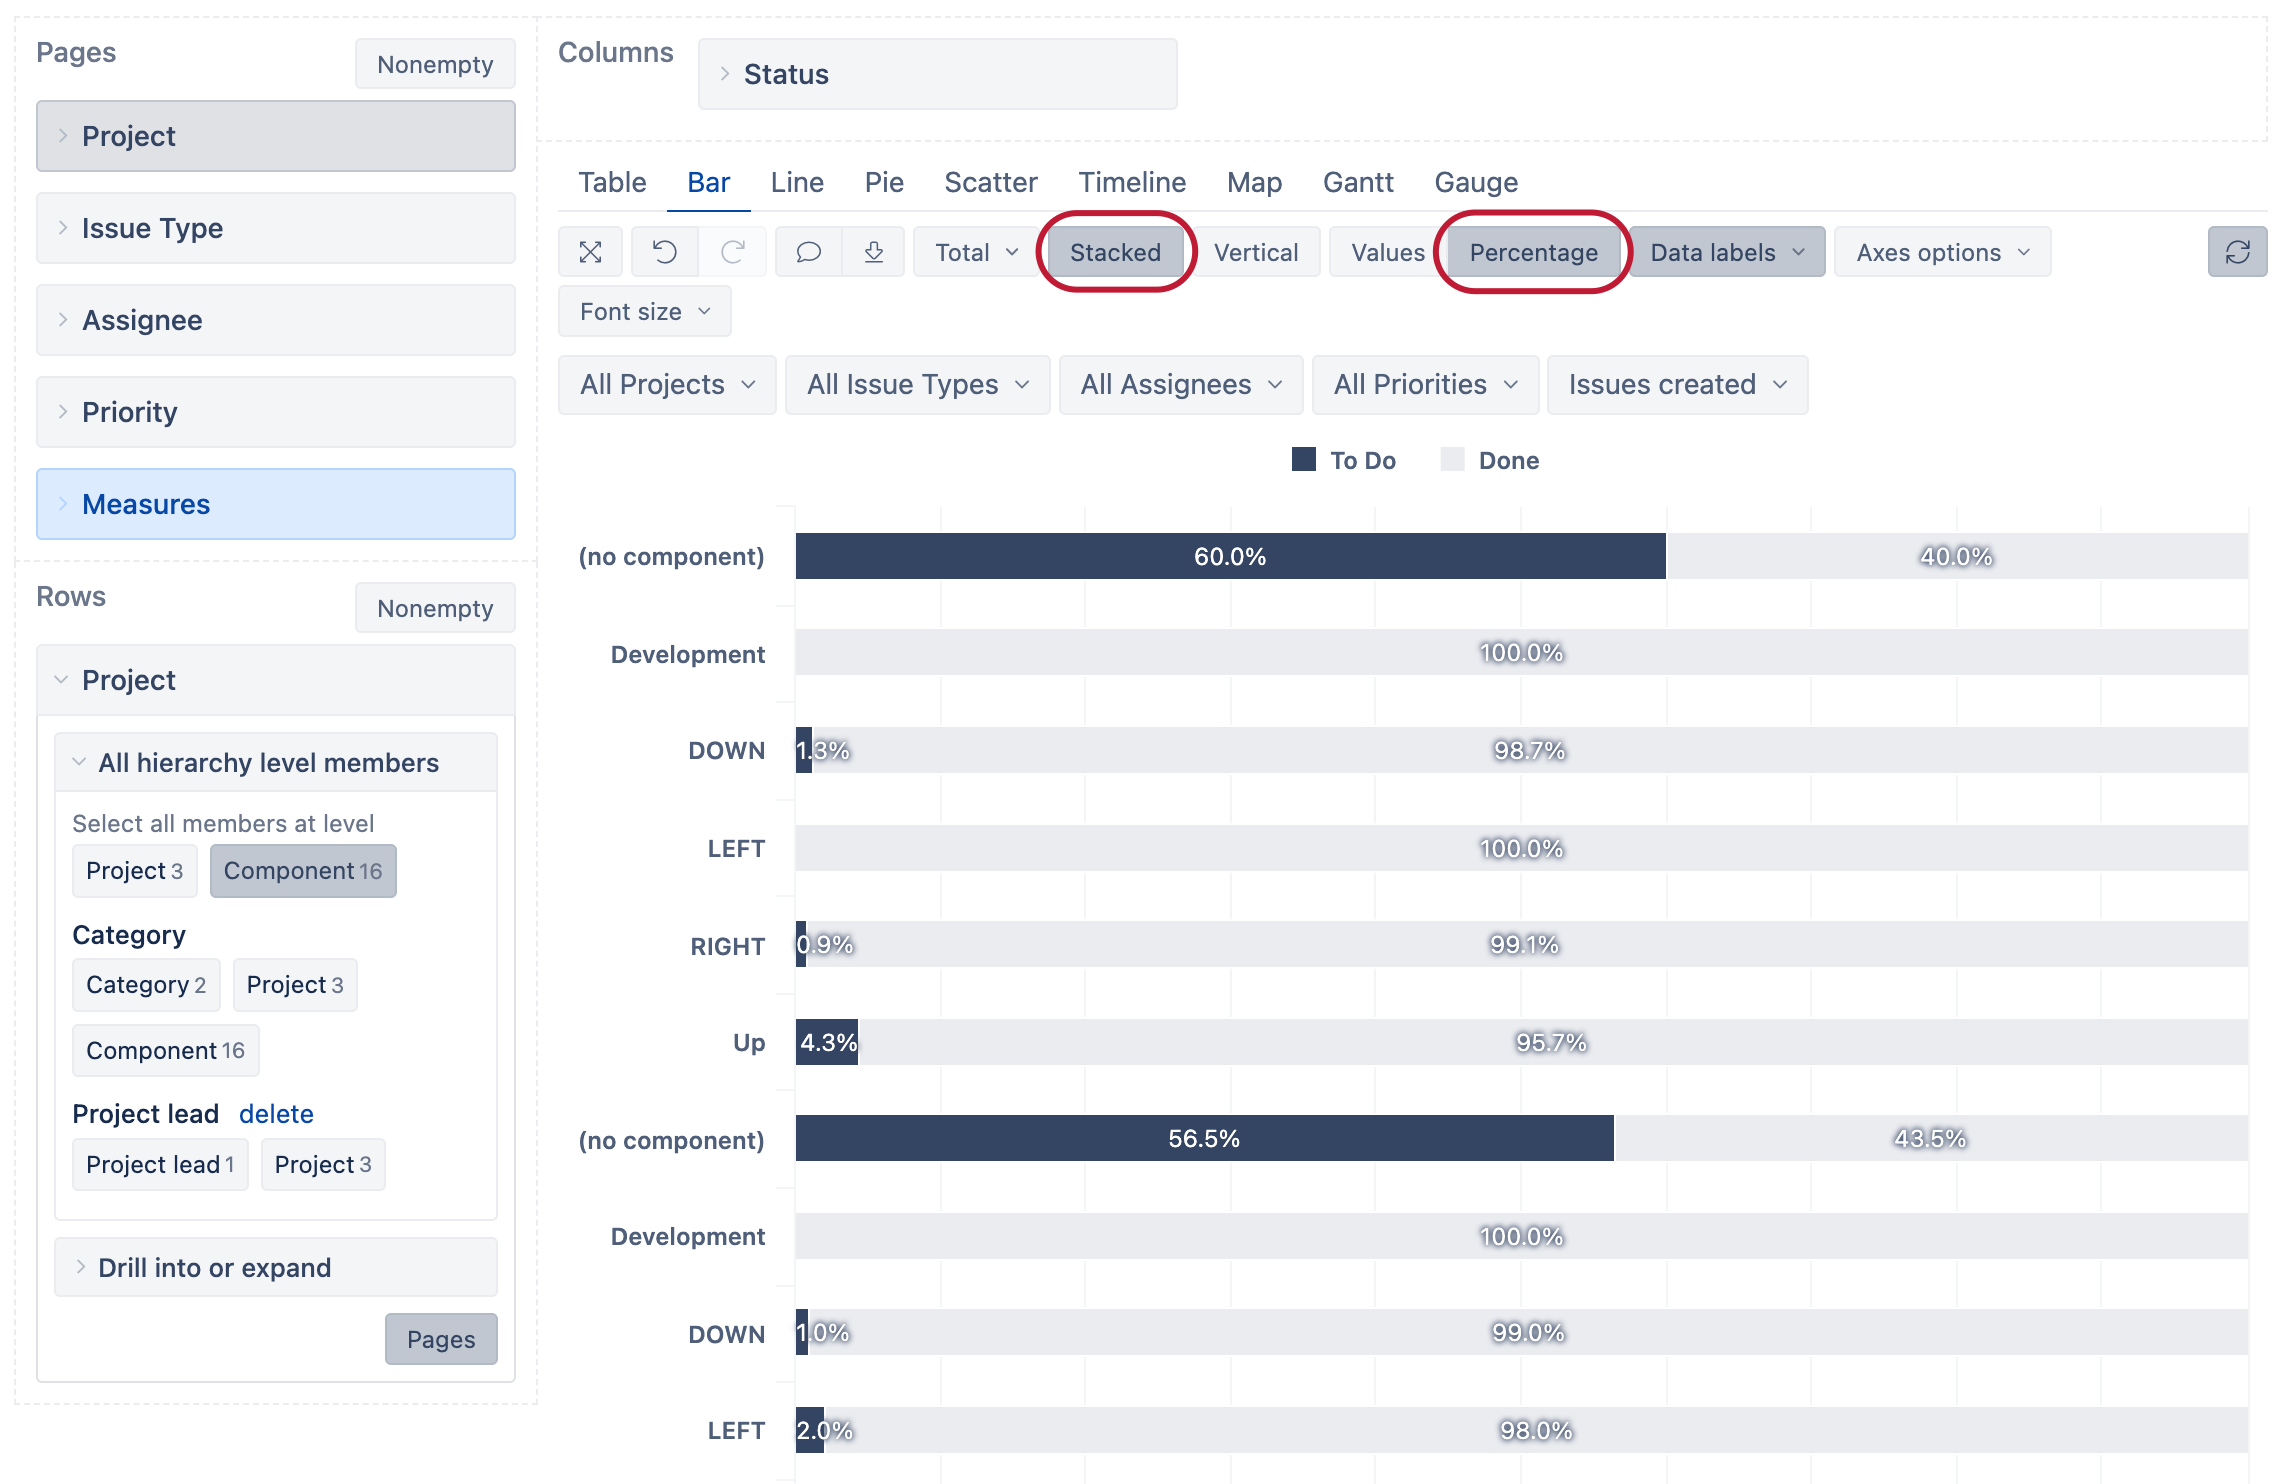
(don’t mind the measures used in this report)
Best regards,
Nauris / eazyBI support