I already have a pie report showing open issues with respective components. But even components that are allocated only once are shown in this pie chart. I need your help to aggregate those components to group called „others“. Since I just began to work with eazyBI, I am still faced to some difficulties of lower level, I think.
HI @ANM,
I understand that some components with only a few issues are making a noise in the report. You might want to show top/bottom components individually and the rest as one aggregated row.
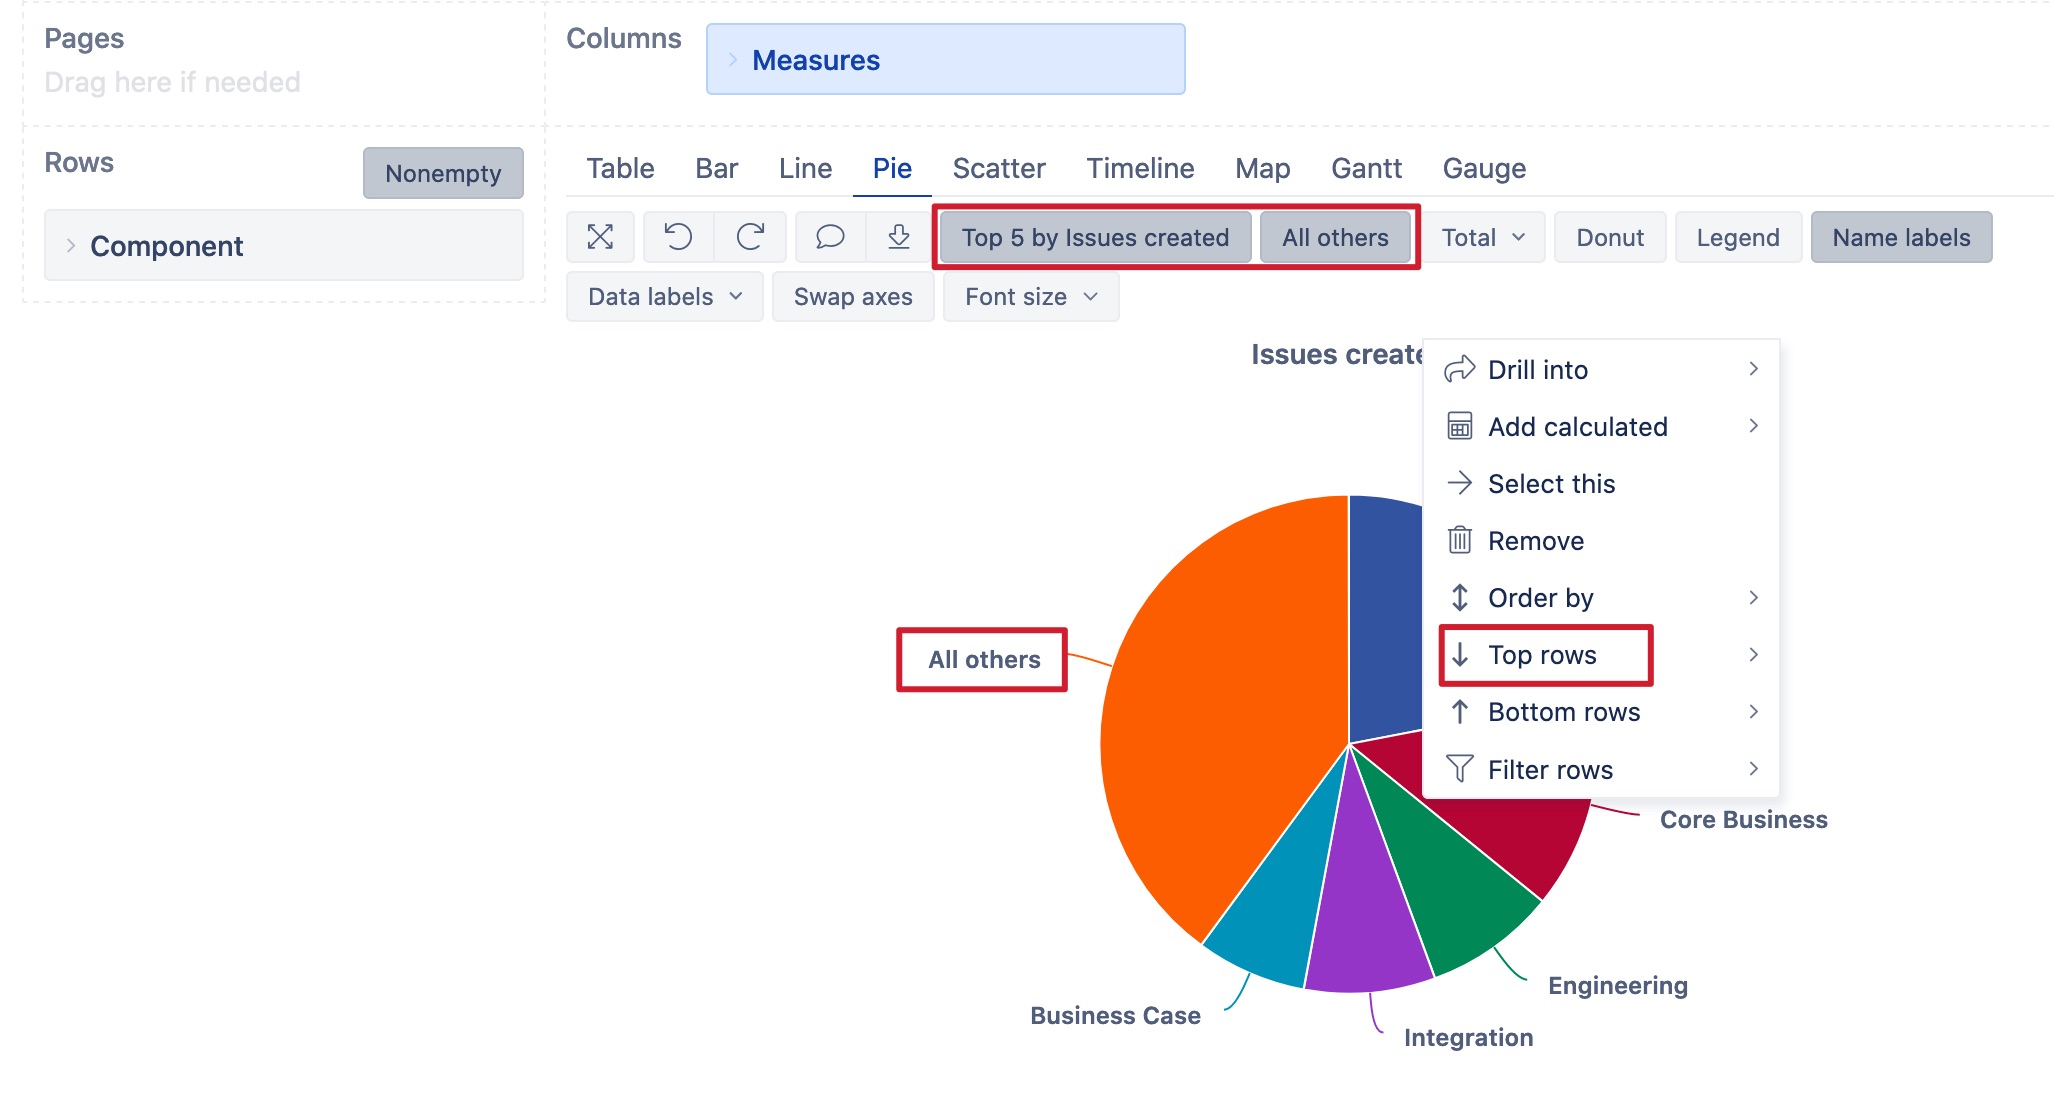
- Click on measure name and select option to show Top rows → N rows → 5
- Then in the report new option should appear for you to see “All others” as one slice of pie (see picture below)
If you are sharing component names across the projects, you may import Component as a separate dimension. For more details on how to do that check out this county post:
Best,
Zane / support@eazyBI.com
perfect! that helps a lot.