Overview
In this example, JIRA has custom field Cost Center and a file with a budget for each Cost Center per month. Cost calculation goes over logged hours and user rate. Users have flat rates in a seperate file.
The example describes how to import both files into eazyBI, mapping budget to custom field Cost Center and Time, and mapping Rate to Logged by User. You could either upload a file, import data via REST API, or SQL, or use Google Sheets in the same way. eazyBI supports additional data import to any existing default field dimension and single select custom field dimensions as properties or measures.
Budget import
A budget should be imported and mapped to custom field Cost Center and Time. A budget should be imported as Measure to enable mapping by several dimensions. eazyBI by default does not allow additional data import to custom fields. This option should be enabled for a custom field that requires additional data import.
JIRA administrator can enable additional data import in eazyBI advanced settings:
[jira.customfield_NNNNN]
data_type = "string"
dimension = true
separate_table = true
Custom field ID should be used instead of NNNNN. Run an import after custom field definition changes.
Prepare a data source with budget data, over time and the custom field values. You could add any other dimensions there as well. Please split data as detailed as you would need for data analysis later. Upload file or setup connection and query for any other data sources. Then proceed to column mapping.
Select JIRA issue cube for additional data import. You would like to import budget as a measure mapped to two dimensions - custom field dimension and time dimension. Select dimension and level from selections list. Set advanced options for mapping data via Name. Usually, you could map custom field value by Name. Set an option ‘Skip missing’ to ignore lines that do not have a value in the eazyBI. eazyBI does not import lines without a proper match and could raise an error and prevent any data import if this parameter is not set.
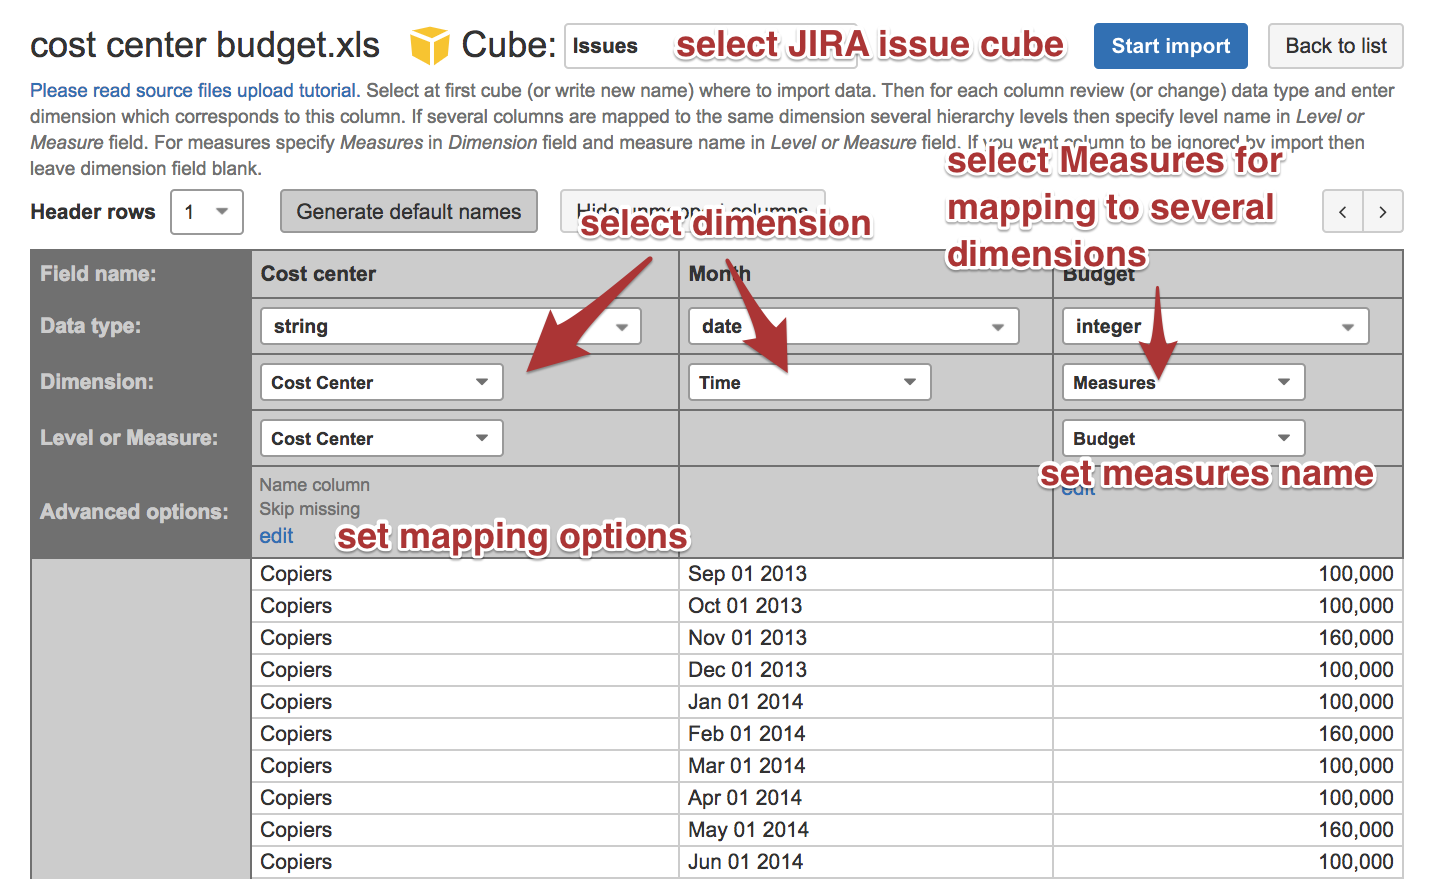
Run an import.
Rates import for a user
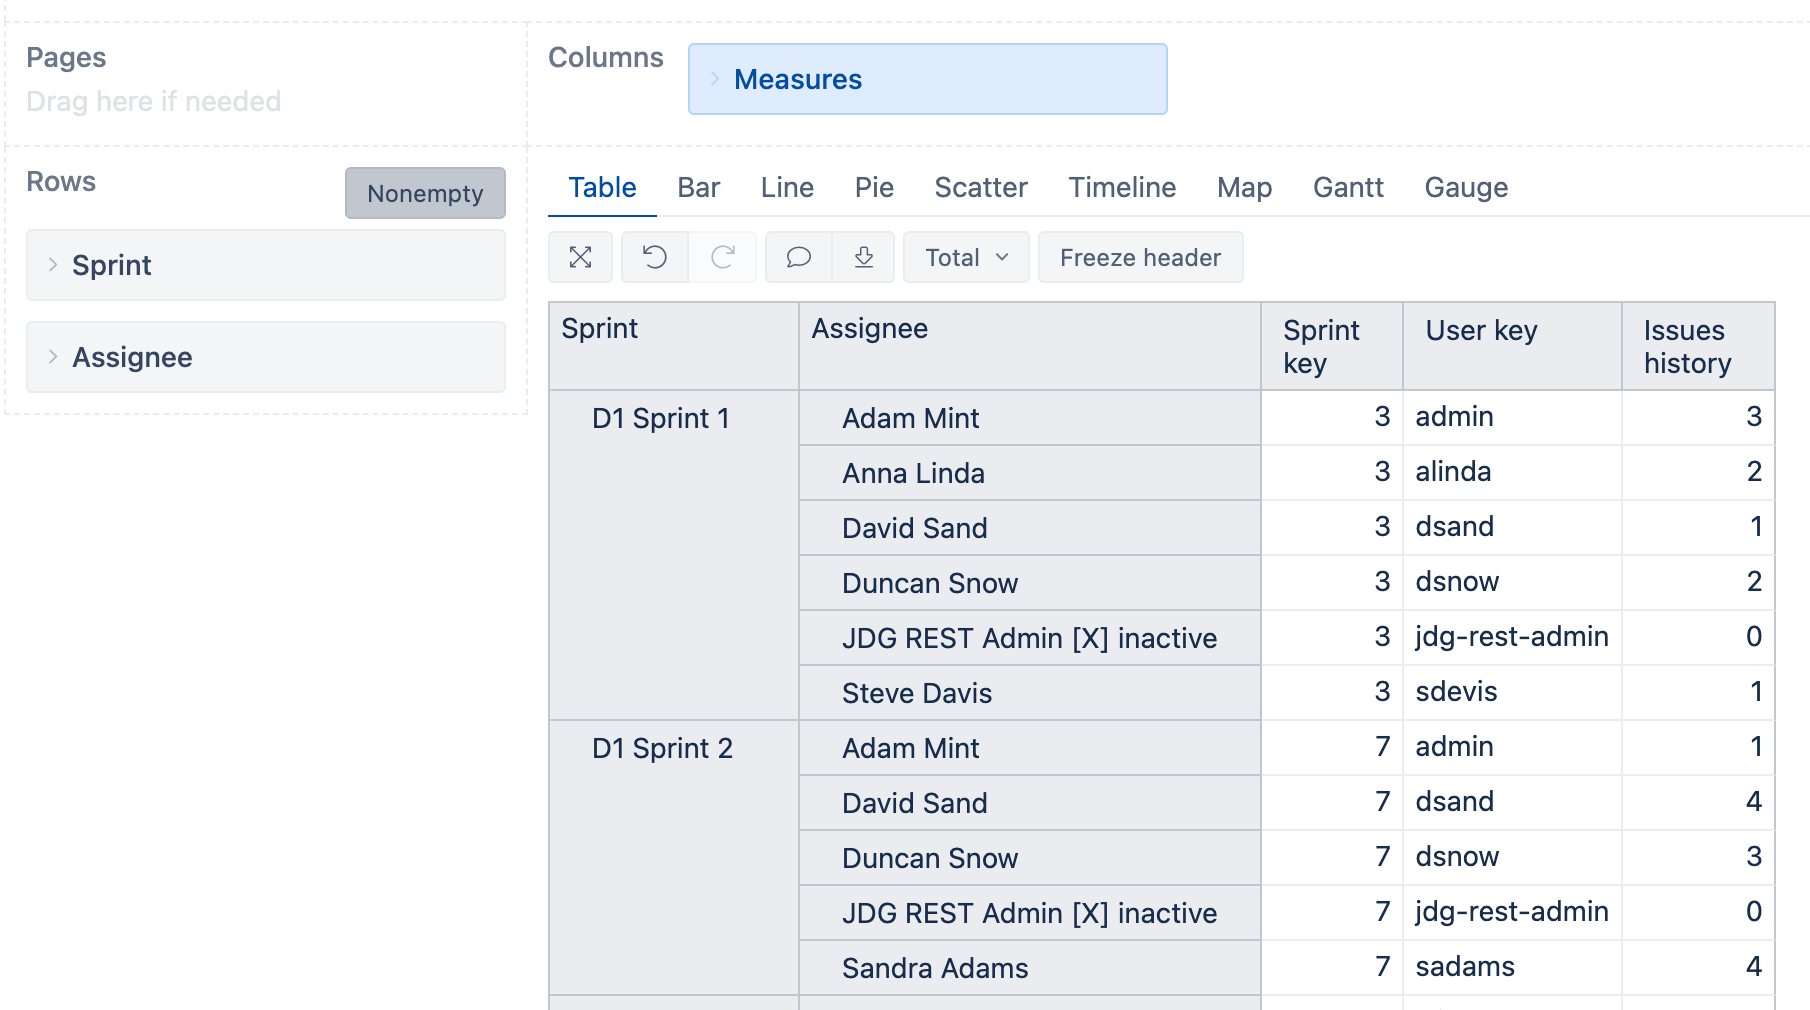
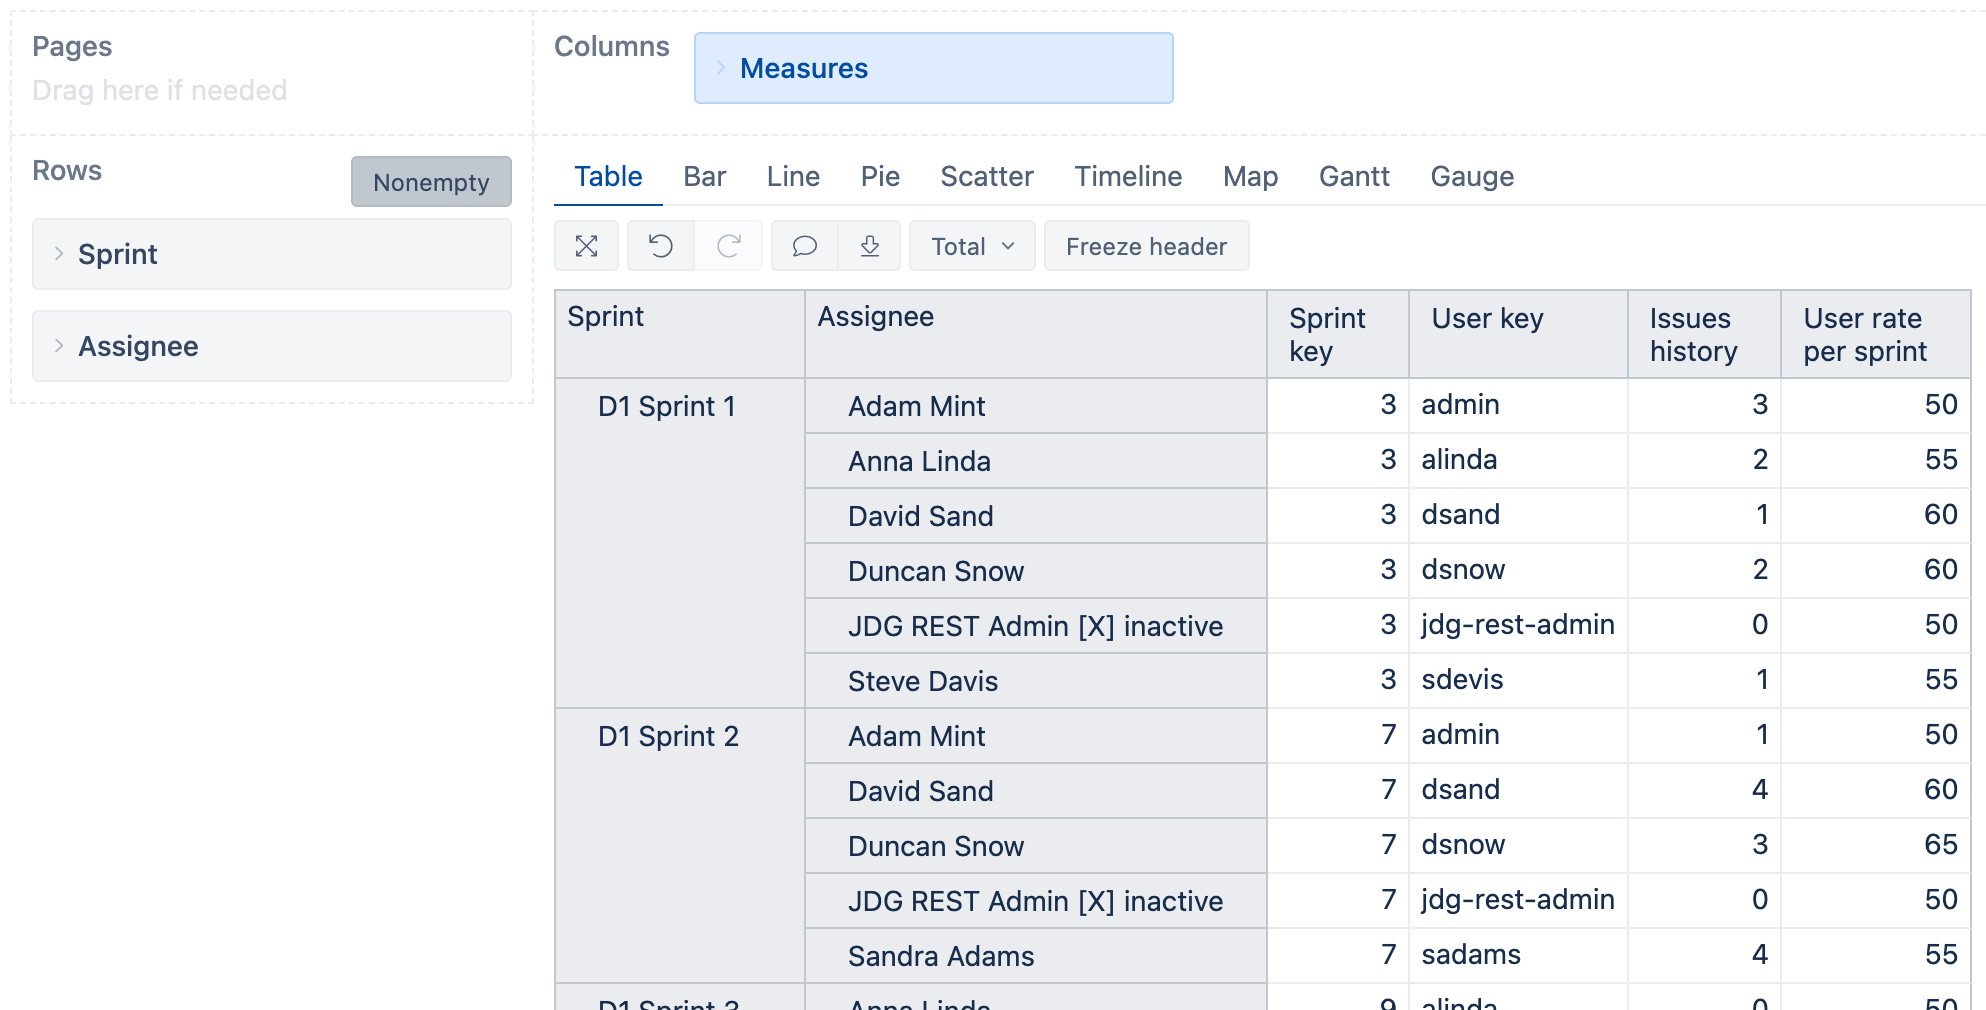
Cost calculation will be done over logged hours. eazyBI has several user dimensions and in this case Logged by dimension is the most appropriate for rate import to users who have logged hours.
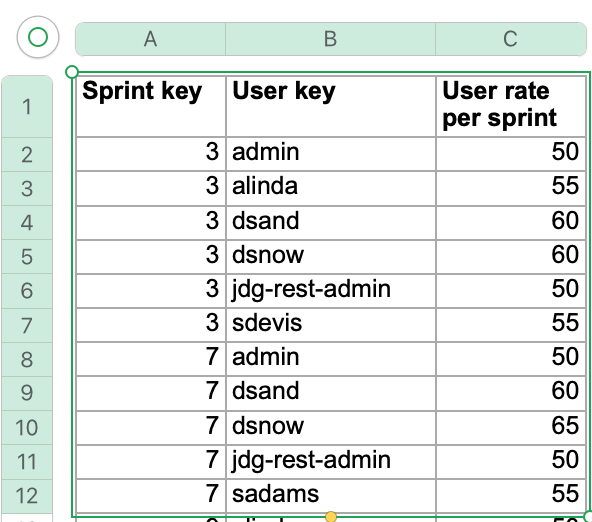
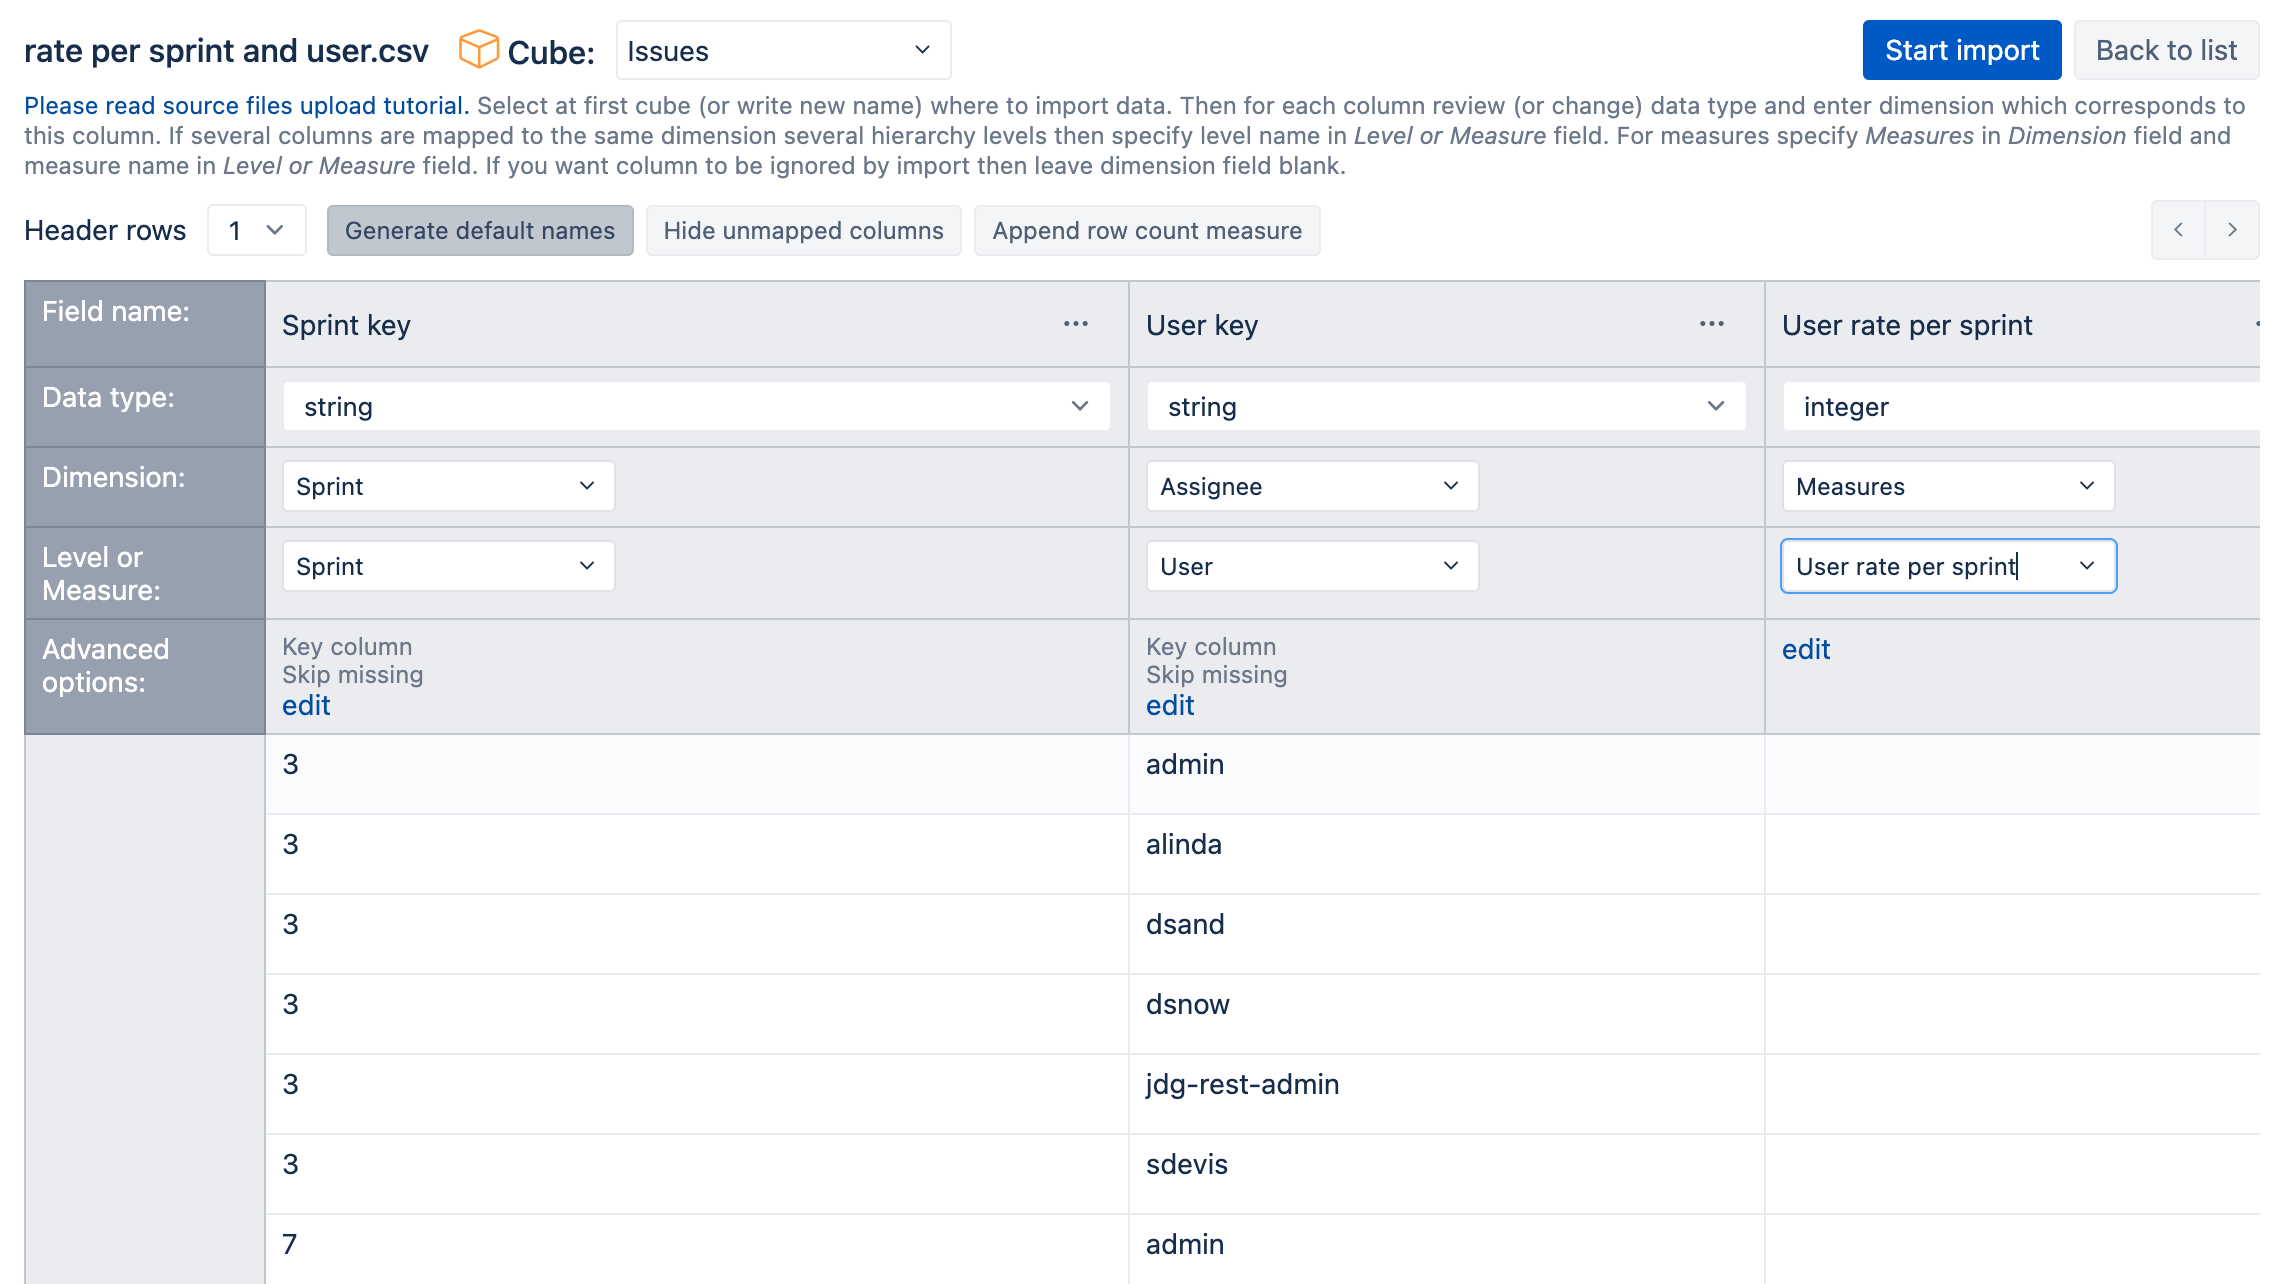
Prepare a data source with usernames and rates. It would be suggested to use a username for mapping as several users could have the same name and surname. Username is unique and would suit better for additional data import. Upload file or setup connection and query for any other data sources. Then proceed to column mapping.
Select JIRA issue cube for additional data import. You would like to import rates as a property mapped to Logged by user on user level. You can import only one property value for each user. Any new property value will override the previous one for the same user.
Select dimension and level from selections list. Set advanced options for mapping data via Key (this selection goes with username). Set an option ‘Skip missing’ to ignore lines that do not match Logged by user in the eazyBI. eazyBI does not import lines without a proper match and could raise an error and prevent any data import if this parameter is not set.
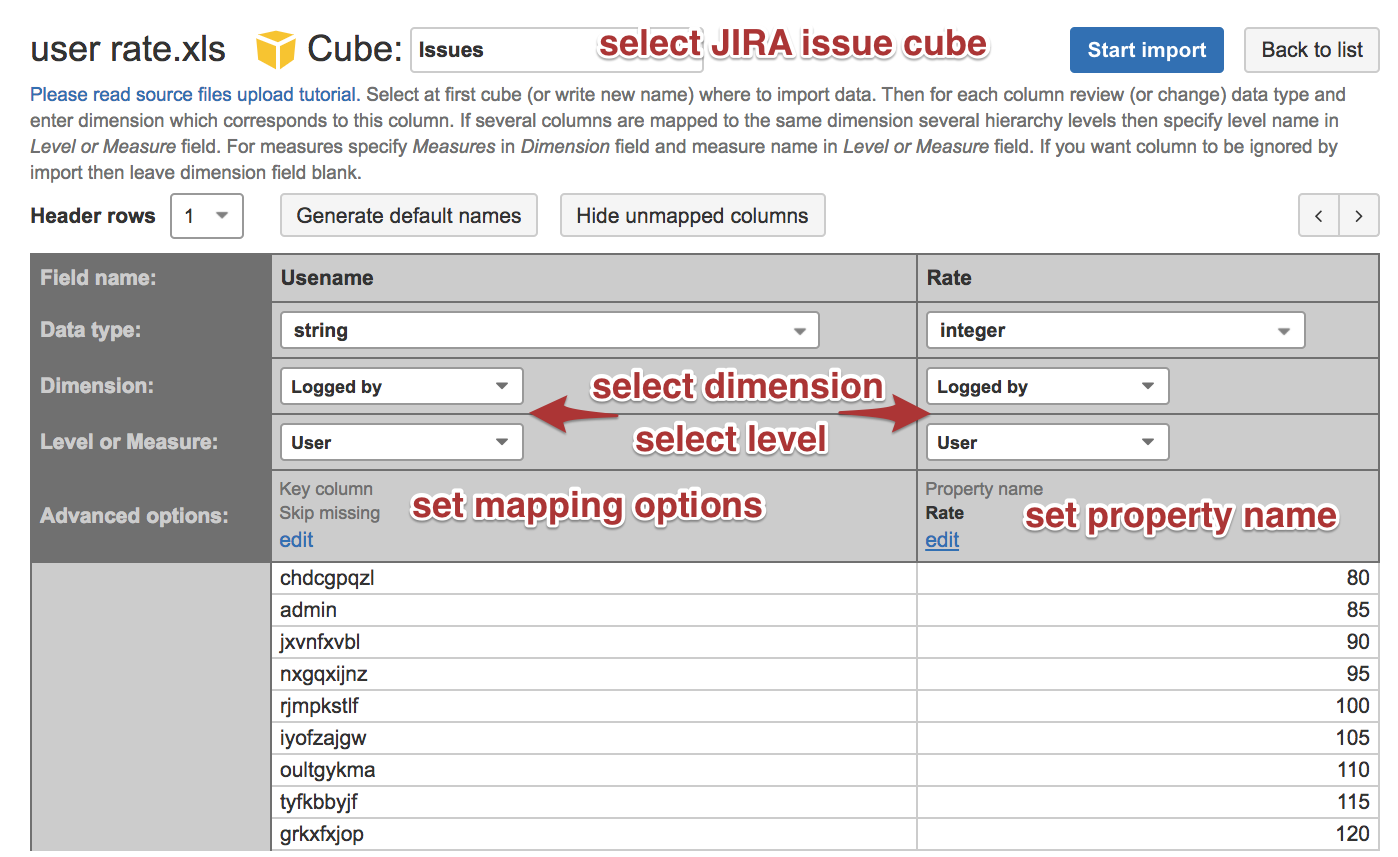
Run an import.
Create a report
A report uses profit/loss calculation subtracting Cost from Budget cumulatively over time to get a value at the end of each period.
Create a calculated measure for “Cost”:
NonZero(SUM(Filter(
  Descendants([Logged by].CurrentMember, [Logged by].[User]),
  [Measures].[Hours spent] > 0),
  [Measures].[Logged by Rate] *
  [Measures].[Hours spent]
))
Create a calculated measure “Cost Center Budget” to get it working in any context in the report:
DefaultContext(
([Measures].[Budget],
[Cost center].CurrentMember,
[Time].CurrentHierarchyMember)
)
Create a calculated measure “Profit/Loss Cumulative” for cumulative profit/loss calculation:
NonZero(SUM(
  {PreviousPeriods([Time].CurrentHierarchyMember),
  [Time].CurrentHierarchyMember},
  [Measures].[Cost Center Budget]
  -
  [Measures].[Cost]
))
Create a report using measure “Profit/Loss Cumulative” on Columns. Use Coste center with Cost center level on Columns as well. Use Time dimension with Month level selected on Rows. Switch your report to Timeline chart. You could also use Bar chart as well.