Hello,
I would like ask you, how to calculate the average of rows where each of them is calculated with a different formula?
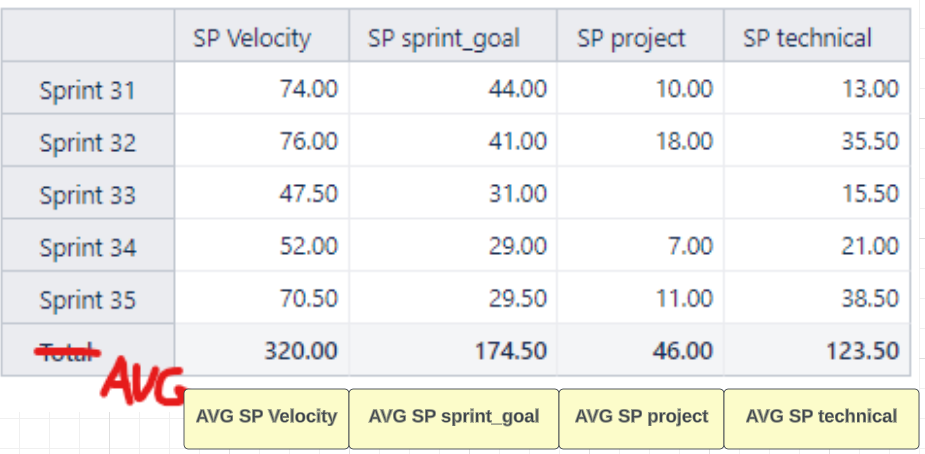
I would like the average to be presented at the bottom of the table under each column and present the average for the values in a given column. As in the attached picture, so that instead of Total it is shown AVG.
I will add that each of the columns is calculated in a different way and the data in the table is displayed for the last 5 sprints.
Is there such a possibility at all?
Hi @mwrobel
Apologies for the delay in my answer!
To override how the “Total” row is working, you can define a new calculated measure and use a formula like this to get the average shown for the SP Velocity:
CASE WHEN [Sprint].CurrentHierarchyMember.Name<>"$total_aggregate"
THEN
[Measures].[SP Velocity]*1
ELSE
Avg(VisibleRowsSet(),[Measures].[SP Velocity])
END
Let me know if this works as expected!
Best regards,
Nauris
Hello @nauris.malitis,
Thank you for your answer.
I’m not sure that you undesrtood me correctly.
I would like to get a situation like in the attached screenshot, that the average value will be shown under each of the columns. As I wrote, each value e.g. SP Veocity, SP sprint_goal, etc… is calculated using different formula.
As you described it, the average will appear as another column and it will only count the average value for the value SP Velocity - (or I misunderstood something) 
Hi @mwrobel
The formula I provided overrides the action of the Total row.
In this case, you would need to either adjust all of your existing measures or define a new set of measures so that each of the columns has this adjusted action of the Total row.
For example, if you wish to adjust the existing members, it would look something like this:
CASE WHEN [Sprint].CurrentHierarchyMember.Name<>"$total_aggregate"
THEN
-- your custom formula here
ELSE
Avg(
  VisibleRowsSet(),
  -- your custom formula here
)
END
Or, if you wish to reference the existing members, then define 4 more measures- each measure for the each of the existing ones using the formula that I previously provided.
Let me know if you have any additional questions on this!
Best regards,
Nauris
@nauris.malitis - ok, we are a bit closer 
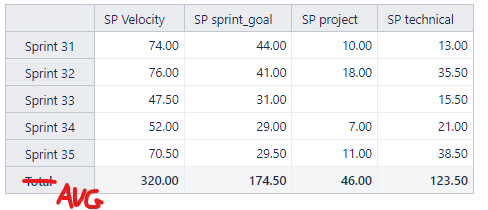
Now I have situation that I have correct AVG values for each column but on the right side of the table in the total row (as in the attached screen).
I would like have this values: 51.50; 26.80, 9.75, 28.38 in the place where there is a total under each of the columns (see the green colour on the screen).
Hi @mwrobel
Happy to see that the measures are working as expected!
At this step, simply remove the “SP Velocity”, “SP sprint_goal”, “SP project”, and “SP technical” measures from the report and use the newly created measures. 
Best regards,
Nauris
Ohh awesome
So… last but not least aspect - if I will present the data in the table as you advice, the “Total” label is still visible and is a bit confusing as it represents an average.
Is it possible to change the name of this label?
@mwrobel
Unfortunately, it is not possible to change this label.
You can however add a description to the report, that explains how the Total row is working: Create reports
Cheers!
Nauris