How to change Pie chart colors based on measure values. I’ve tried with changing cell colors in
but didn’t changed in Pie chart. Is there a way to have this functionality or how can I enable it.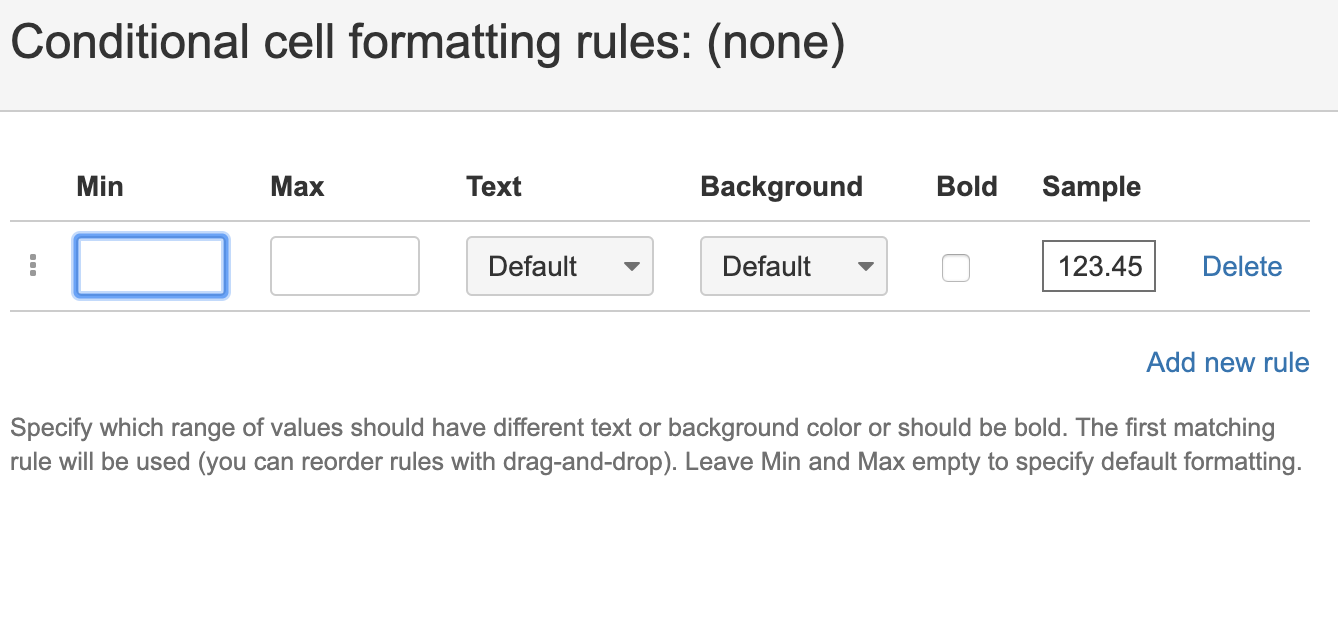
Thanks
How to change Pie chart colors based on measure values. I’ve tried with changing cell colors in
but didn’t changed in Pie chart. Is there a way to have this functionality or how can I enable it.Thanks
I believe the “Conditional Cell Formatting” only works in the Table View.
Yes, I’ve figured it out lately that it works for tables only.
But still question stands if there is a way to have dynamic color changes in pie charts based on values.
Hi, the workaround to do it will be to define additional measure and using CASE keyword to suppress it per some condition.
For example: let’s say my condition is X > 0
I need to create two measures:
One with CASE X> 0 and one with CASE X <= 0
This way only one of the measures will appear in the table (assuming to selected Hide Empty Columns), and now if you show it as pie chart, you can assign different colors to each measure, and the colors of the pie will be changed per the condition.
Yes, you are correct. Conditional cell formatting works on Table reports only.
Currently, we do not have an option to use coloring according to values in pie chart (or any other chart). We have some ideas in our backlog to support more advanced coloring options. I will add the community vote for those ideas and will add the comment here when there will be any changes.
Daina / support@eazybi.com