Hi,
Can anyone tell me how to get this done in EazyBI? I am trying to coming issue created date and Due date.
Resolved issues with due dates on range chart - Issues - Jira Demo - eazyBI
Hi,
Can anyone tell me how to get this done in EazyBI? I am trying to coming issue created date and Due date.
Resolved issues with due dates on range chart - Issues - Jira Demo - eazyBI
@zane.baranovska I’d appreciate if you could help with this.
Hi @Joshua
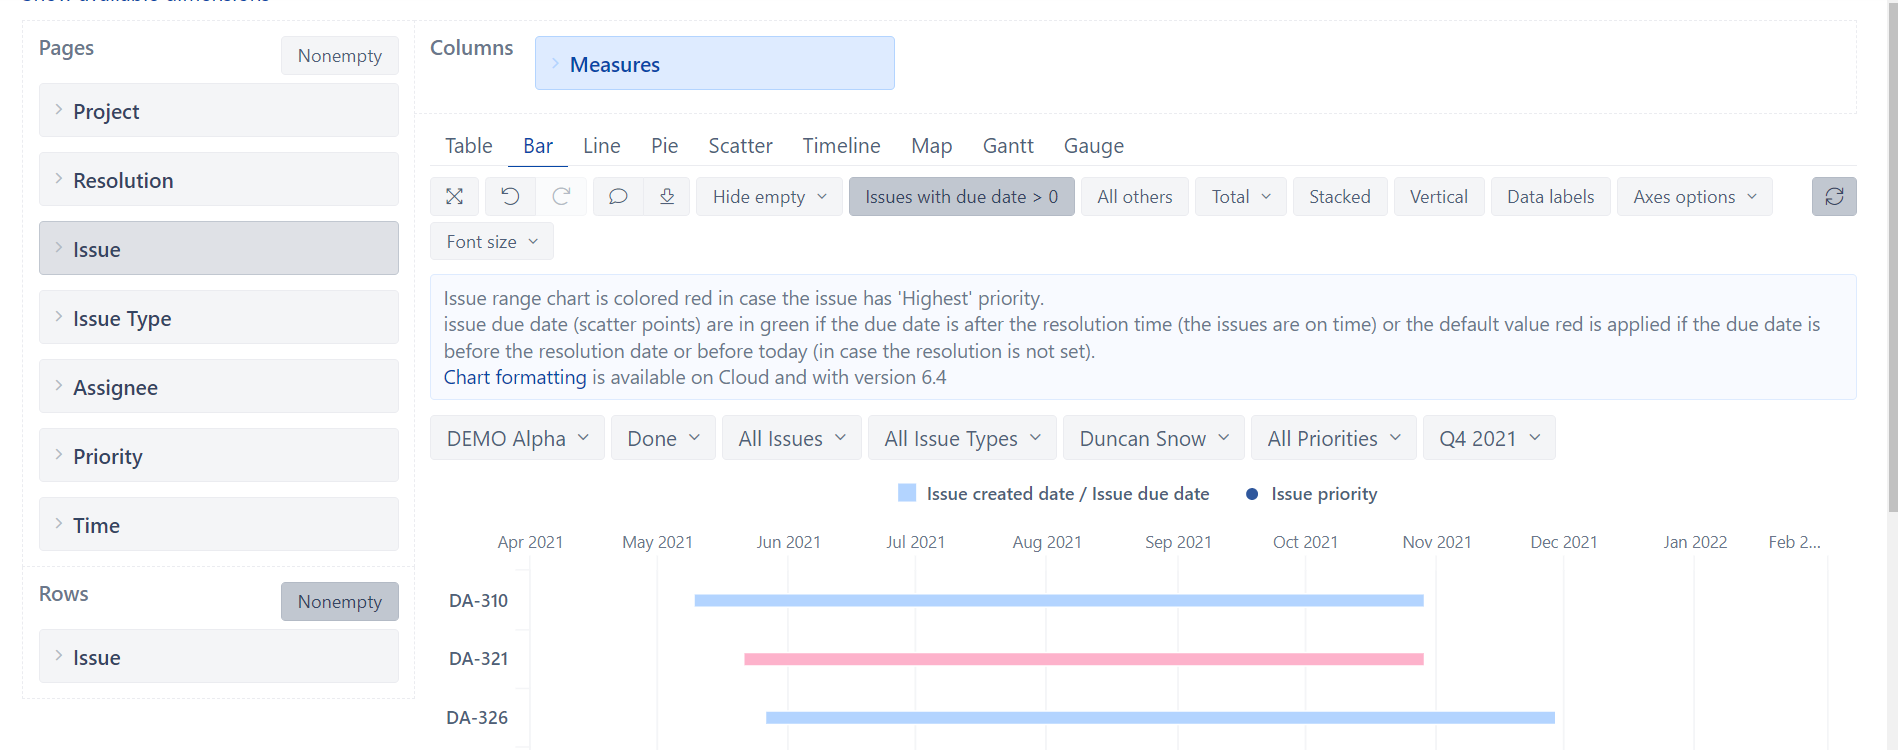
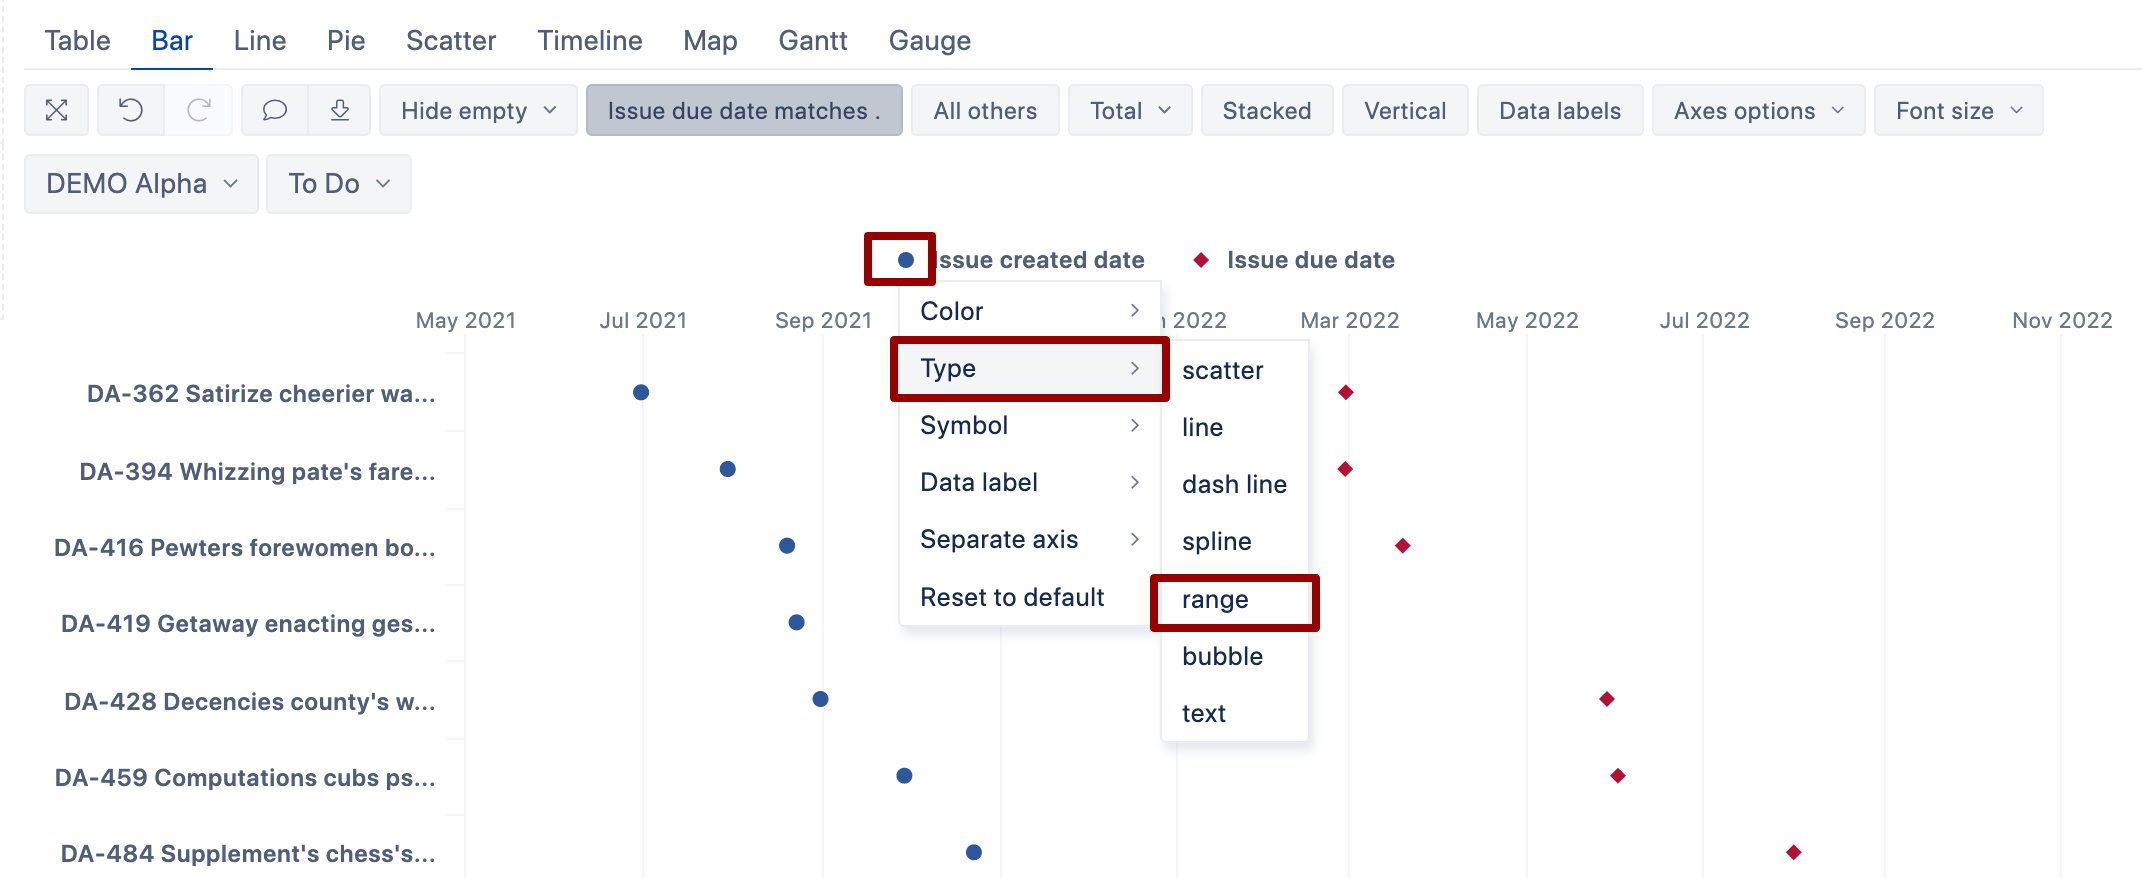
This is so-called range bar chart that can be drawn between two side-by-side added dates (Issue creation date, Issue due date). When you add two dates in the report table columns, then, by default, in the bar chart view, the dates would appear as scatter points.
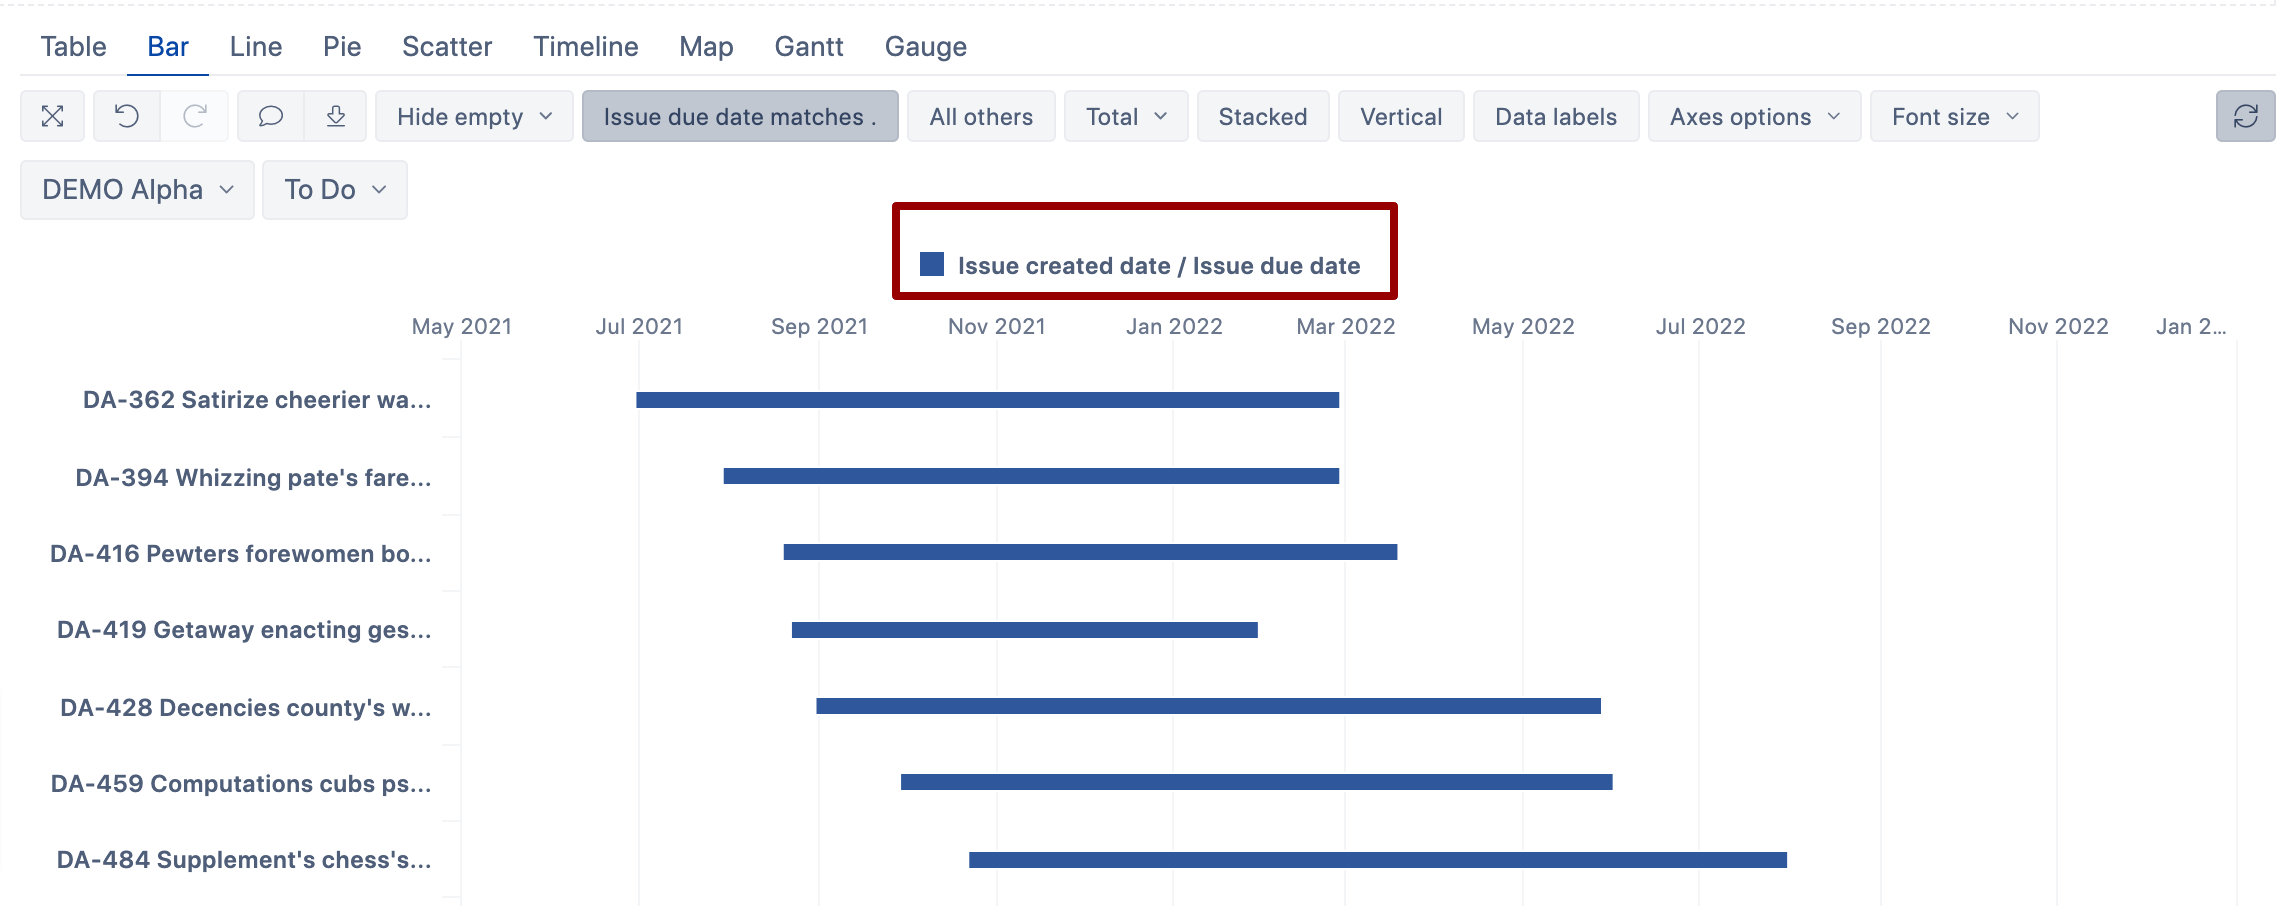
Click on the legend of the first date, select Type > Range, and the bar between that and the next selected date would be drawn.
You can see by which dates the bar is drawn in the legend:
You may want to watch a short training video episode on how to use range bars: Training videos (from 4:30)
Ilze, support@eazybi.com