I’m fairly new to eazyBI and I think I’m getting the hang of it, but I could use some help with the following.
We have a custom field ‘Estimate’ created in JIRA and imported in eazyBI. In this field some of our teams add their estimation as a t-shirt size (s, m, l, xl).
Those sizes can be related to story point (s=1, m=3, l=5, xl=8).
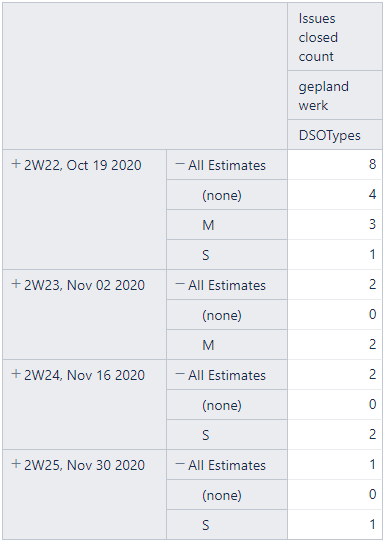
Now I like to get a graph wich shows the velocity, but I will need to convert the t-shirt sizes to story points. So far I have created the table as shown belown, but I get stuck at the convertion, could you please help me?
Here the recommendation would be using Javascript in advanced settings to define a new calculated field (which will be calculated during data import) and then import it as a separate dimension in the cube.
When defining it, you could replace values with numbers.
Try something like this where you use your Estimate customfieldID instead of NNNNN
[jira.customfield_estval]
name = "Estimate value"
data_type = "integer"
dimension = true
javascript_code = '''
if (issue.fields.customfield_NNNNN  && issue.fields.customfield_NNNNN.value ) {
	tshirt = issue.fields.customfield_NNNNN.value
	val = 0;
	switch(tshirt) {
		case "S":
			val = 1;
			break;
		case "M":
			val = 3;
			break;
		case "L":
			val = 5;
			break;
		case "XL":
			val = 8;
			break;
		default:
			val = 0;
			break;
	}
	issue.fields.customfield_estval = val
}
'''
But I would always recommend validating the Javascript part in import options for issue-key (example) page as described here:
In this approach, the original custom field “Estimate” should also remain imported in the eazyBI cube.
Then you could use the new dimension “Estimate value” in the report and it would group issues by the new estimate values.