Hi, I have a list of Insight Objects which have about 5 select attributes. These attributes have select options:
I want to create a graph that shows for each attrbute:
- A count of objects that have value Done AND A count of objects that have value Later
Regards
Amir
Hi,
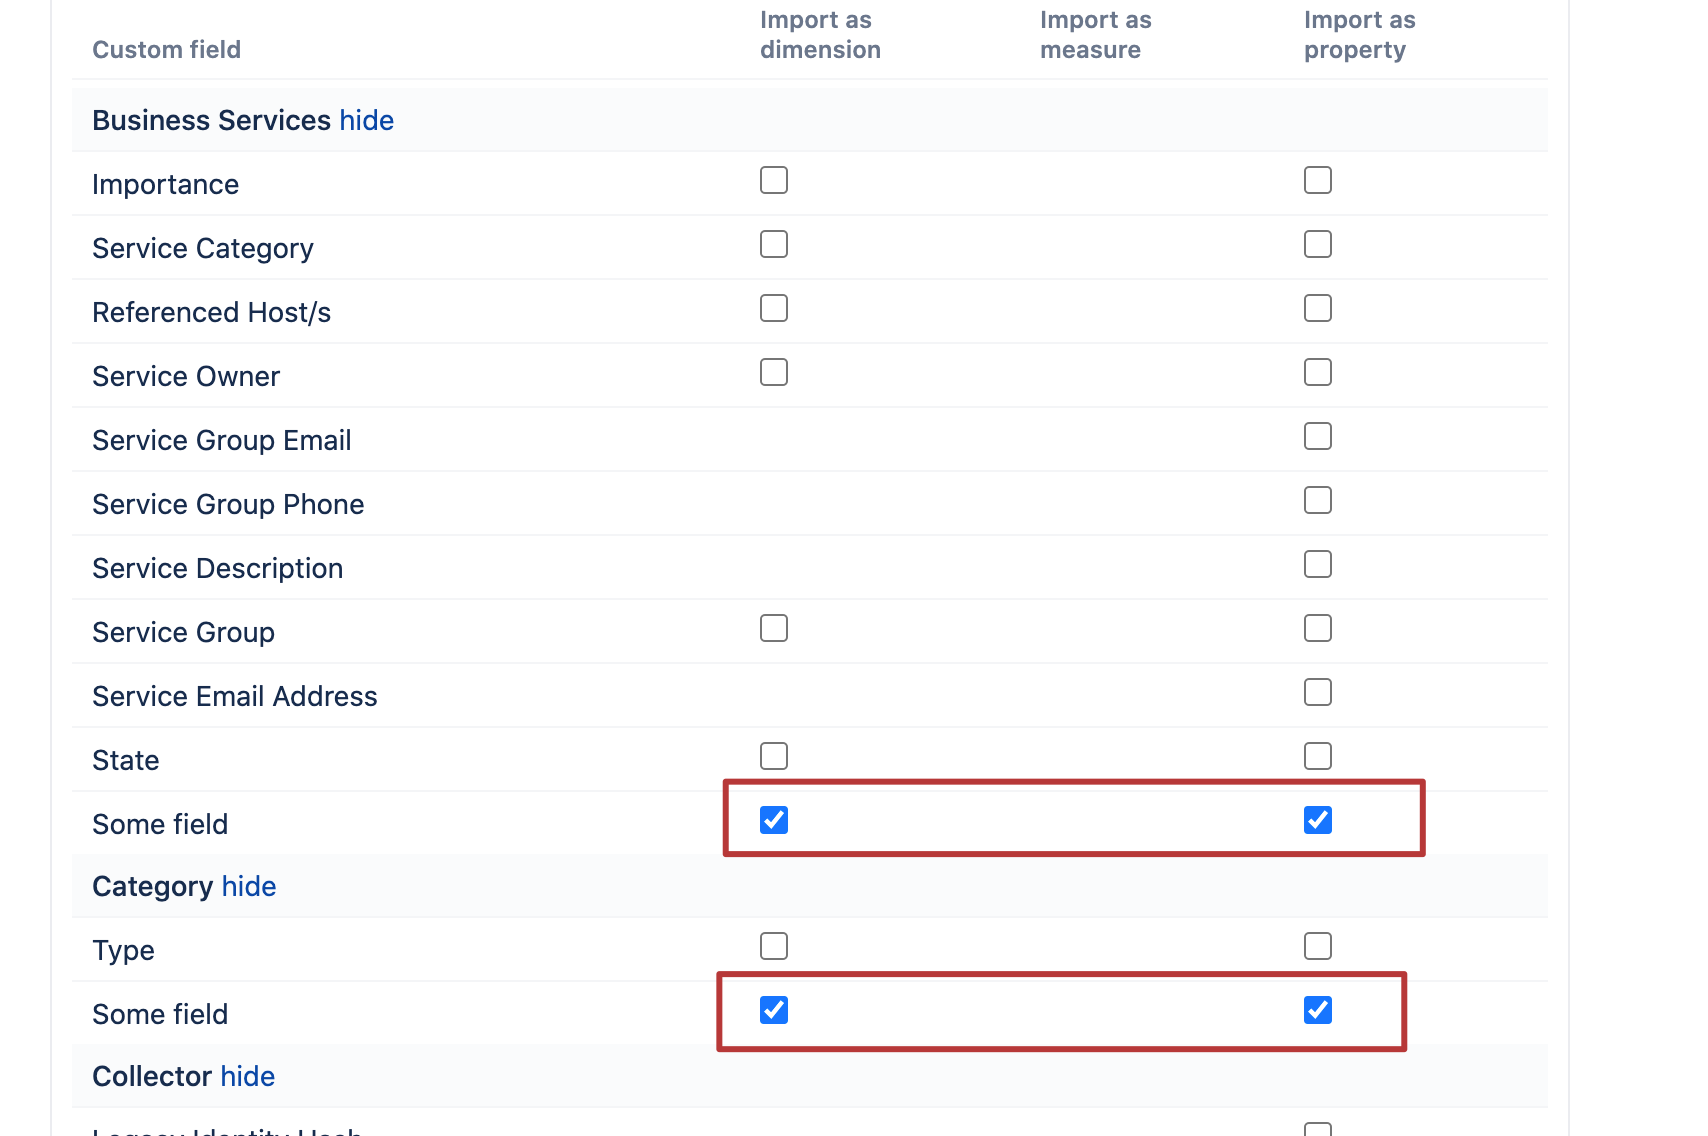
The select attributes must be selected for import for each object type in eazyBI. In my scheme, I have Some Field with select options for Business Services and Category object types:
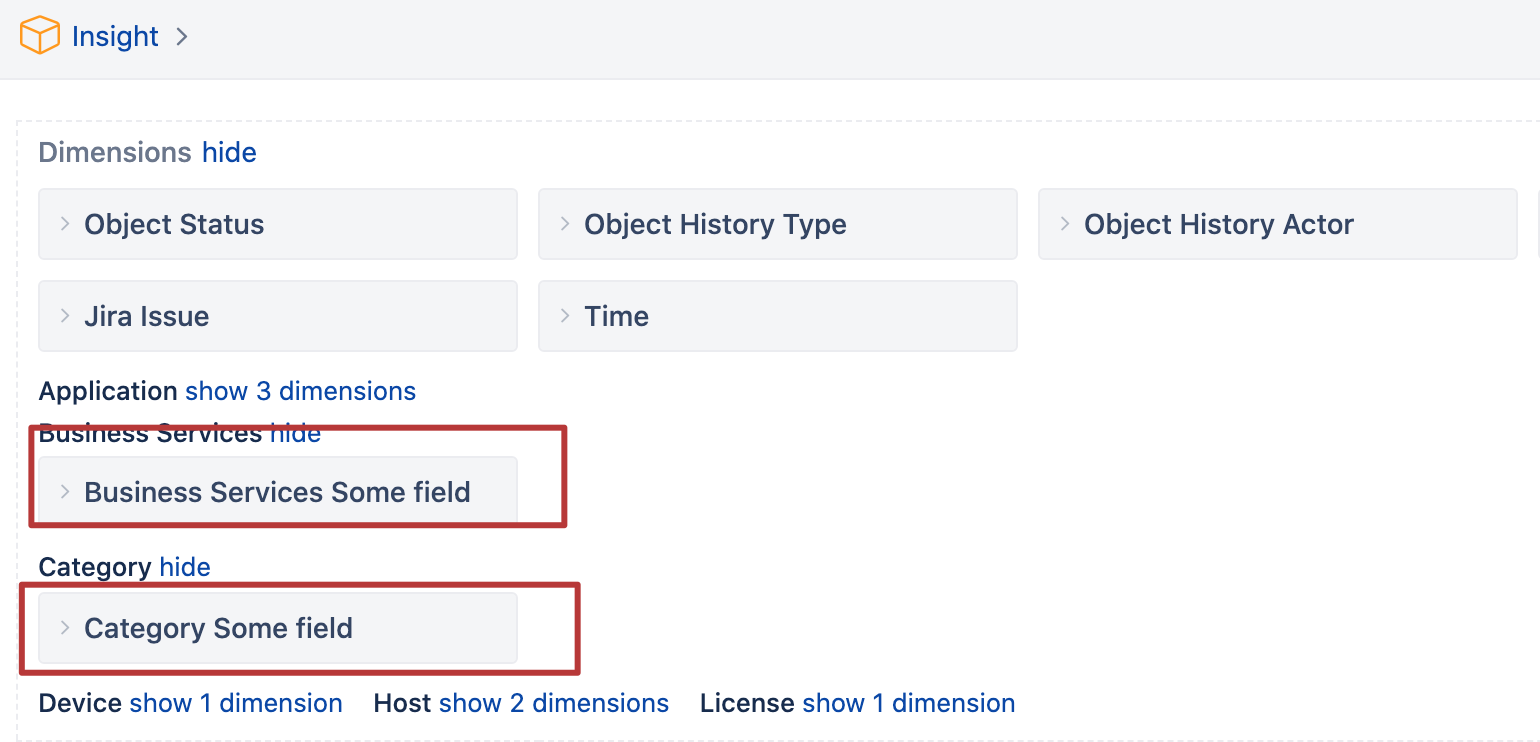
Such selection creates separate dimensions for respective object types:
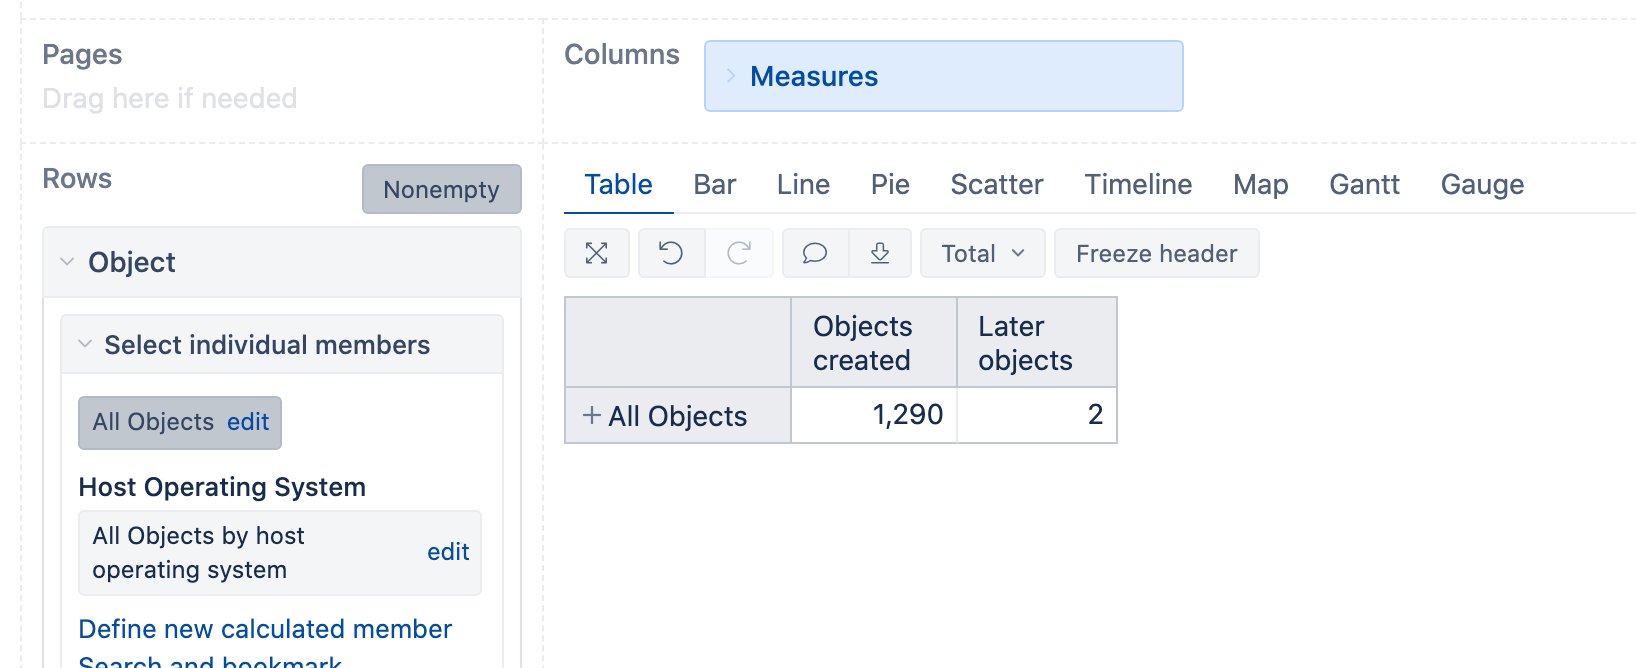
To have the count of all objects with “Later” selection, I used the following formula:
([Measures].[Objects created],
 [Business Services Some field].[Later])
 +
 ([Measures].[Objects created],
 [Category Some field].[Later])
Kindly,
Janis, eazyBI support
Thanks for reply Janis and sorry for my late reply. But I was more thinking of a table that shows the attribute distinction. Similar to:
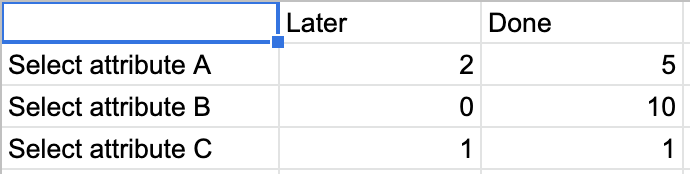
Using your method above I had to manually add each Attribute + value as different columns. There must be a simpler way?
Regards