I have created a rich text field in my jira instance to contain example mapping artifacts for stories.
I would like to make a trend chart that shows how many jira issues have any text in that field, in other words “NOT isEmpty()” I think.
How would I create a measure to do this? It’s not how many issues were created like that, or resolved, or are currently unresolved - just how many exist in the jira instance. The resulting chart would be constantly increasing to various degrees. I think my problem is identifying a measure to add context to the report. I say that because of this similar solution that yet is not helping me: How to find the count of issues with EMPTY Case Numbers and NON EMPTY Case Numbers
Hi @kevinwhite-verint ,
Can you please share the measure you have created based on that community article?
Your measure should look like this. Measure “Issues created” is needed to define that the issue exists, if it has a creation date, it has been created:
NonZero(
  Count(
    Filter(Descendants([Issue].CurrentMember,[Issue].[Issue]),
     NOT IsEmpty([Measures].[Issue YOUR TEXT FIELD PROPERTY] AND
      --measure to add context of the report
      [Measures].[Issues created] > 0 )
    )
  )
)
See more details in my colleague Zane answer here:
NonZero(
  Count(
    Filter(Descendants([Issue].CurrentMember,[Issue].[Issue]),
      NOT IsEmpty([Measures].[Issue Example Map]) AND
      --measure to add context of the report
      [Measures].[Issues created] > 0 )
    )
  )
)
However, the difficulty is that I added this field recently in late October or early November, and yet it will show issues on a trend chart back when they were really created. I don’t need to see issues created over time that have this field not null; I need to see the number of issues with this field not null at each member of the time series. I hope that makes sense.
@kevinwhite-verint ,
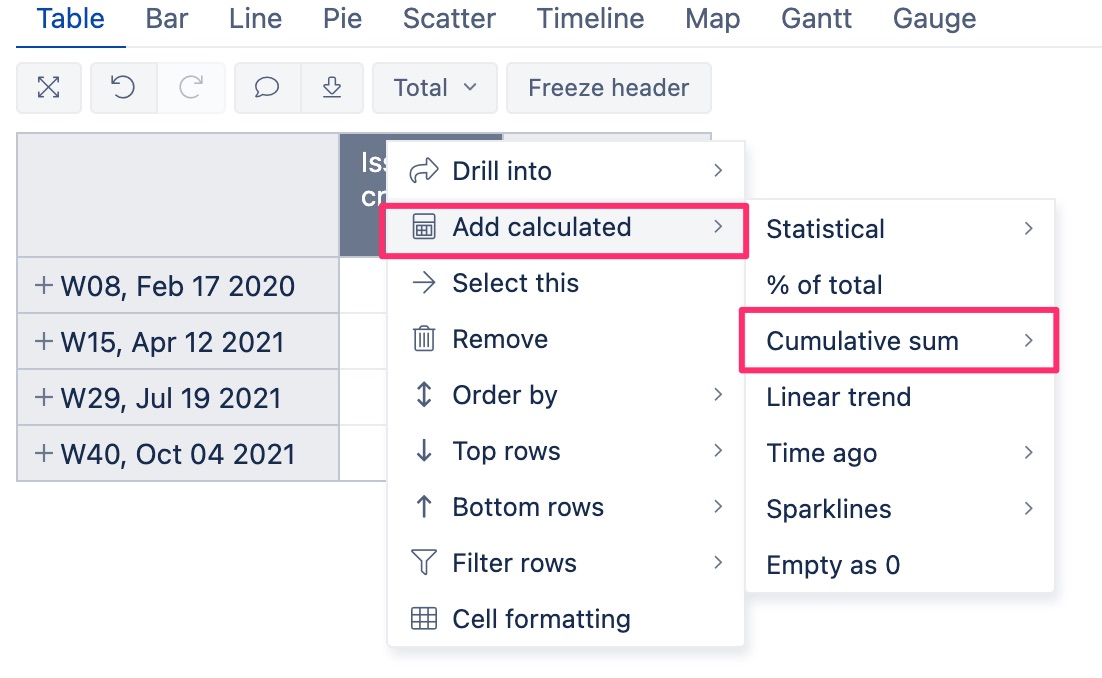
Do you mean like cumulative sum? That the measure should count all issues created from the first day till today?
For that, you can explore standard calculation - Cumulative sum on top of the created measure.
This is a string field that only imports as a property; I think I need to go and configure it to import value changes, and then I’m looking for when it has changed from null to not null somehow.
I know it took a long time for me to come back to this, but I’m half on the right track. The Cumuluative Sum definitely gave me the cumulative trend chart I wanted.
However, my original problem is still happening. It seems like the measure is ‘tied’ to issues created. I’m not interested in when issues were created - I am interested in when they had a value entered for their “Example Map” field which is a text field (it contains a link, etc.) So I can chart the amount of tickets that get that field set to a value, per time hierarchy unit (per day, week, month, etc). When I graph this right now as it stands using the original measure, the most recent value is the correct amount for the total number of tickets with that Example Map field set; and the previous time blocks are showing how many issues were CREATED during that time block, and which now have “example map” set.
To put it another one, I am looking for the Transition History / Transition Status equivalent for this custom field.