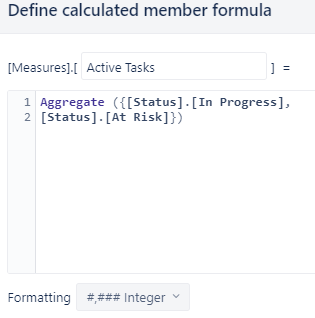
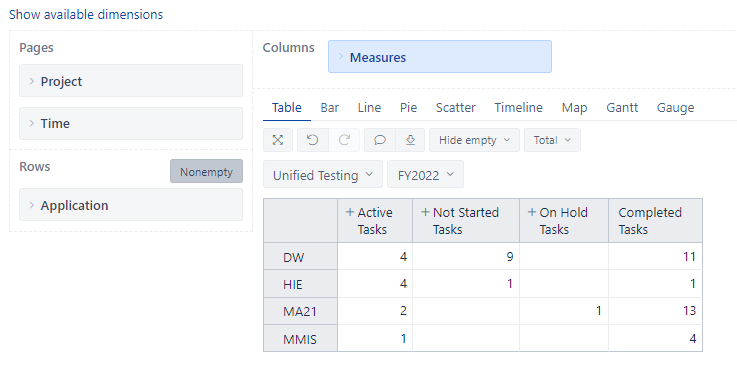
I’m failing to find the best way to reflect what I need in a report and currently missing. I’m trying to show a count of tasks based on their statuses within our fiscal year applied in a time dimension. With this current setup for FY2022 I am missing some of the “Active Tasks” in this count. I am missing those that were created in FY2021 and remained in the “In Progress” status into FY2022. How should I count any tasks that are currently in the “In Progress” status with the Time dimension applied?

I’m trying to take a new approach now as I’m not making must head way. I’ve removed the Fiscal Yr Time dimension and trying to edit my ‘Completed Tasks’ measure to count tasks that have been completed/resolved with a resolution date on or after July 01 2021. Can I get some guidance on this?
CASE WHEN [Measures].[Issues resolved] > 0 THEN
NonZero(Aggregate(
Filter(
Descendants([Issue].CurrentMember, [Issue].[Issue]),
DateBetween(
TimeValue([Issue].CurrentMember.getdate(‘Issue Resolution Date’)),
TimeValue(DateParse(“2021-07-01”)),
TimeValue(DateParse(“2022-06-30”))
)
)))
END
I’m not sure if I’m getting closer with this approach but I’m receiving an error. Help Please
Sum(Filter(
Descendants([Issue].CurrentMember, [Issue].[Issue]),
[Measures].[Issue resolution date] >= ‘Jul 01 2021 00:00:00’),
[Measures].[Issues resolved])
Hi,
A couple of comments about your initial question.
Once you create the calculated members in the Measures dimension without explicitly referring to any other measure, the formula implicitly joins the default Issues created. Your aggregate formula thus shows the issue currently in the aggregated statuses and created within the selected period.
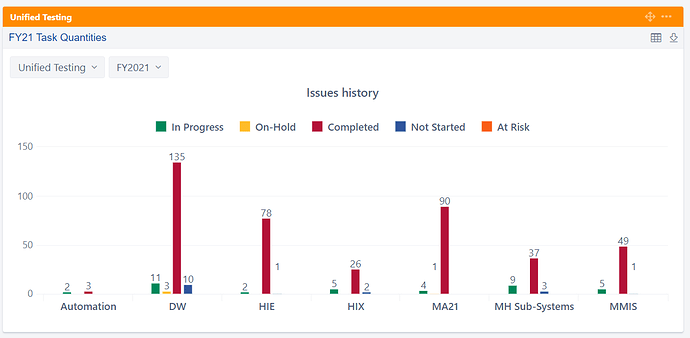
For getting the issues in status at a specific period, you should use the Issues history measure and Transition status dimension. Please, check an example report in our Demo account: Cumulative flow diagram - Issues - Jira Demo - eazyBI.
Your formula for the completed tasks after June 30 is on the right track. You should apply correct filtering to filter issues with resolution date after a specific date:
NonZero(Count(
  Filter(Descendants([Issue].CurrentMember,[Issue].[Issue]),
  DateCompare([Measures].[Issue resolution date],
  DateParse("Jun 30 2021"))>0
  AND
  [Measures].[Issues resolved]>0
  )
))
There is, however, a more efficient formula for this use case, not iterating through all the issues. For example, if the period can be defined by months, the following formula should do:
Sum(
  {[Time].[Month].DateMember("Jul 2021"):
    [Time].[Month].CurrentDateMember},
    [Measures].[Issues resolved]
)
Kindly,
Janis, eazyBI support
Thank you! I think this helped me better understand how I need to display data for both fiscal year 2021 and 2022.
Utilizing the Issues History is most appropriate for our FY2021 (Jul 01 2020 to Jun 30 2021). This should be providing the number of issues that were at these statuses for each application at the end of the fiscal year, Jun 30 2021. Do I have this correct?
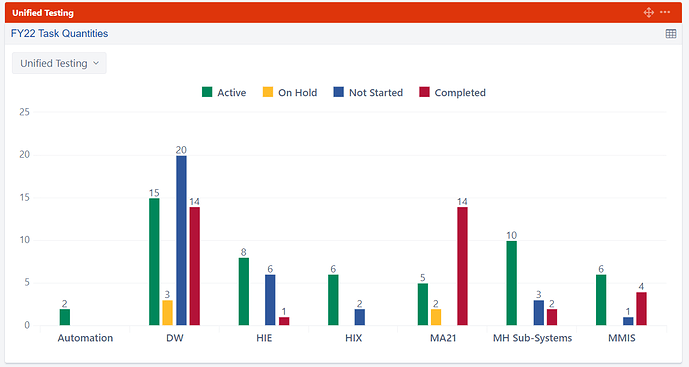
Utilizing the formula for completed tasks after Jun 30 2021 is most appropriate for our FY2022 (Jul 01 2021 to Jun 30 2022). The completed measure will provide the number of issues resolved after Jun 30 2021 and the active, not started and on hold measures are solely provided the number of issues currently in those statuses.
Once we reach the end of FY2022, I will need to provide the number of issues resolved between Jul 01 2021 to Jun 30 2022. Would issues history be able to show this or would I have to alter my completed measure?


