I am trying to create a table like below by showing the total stories completed and UAT defects logged. Challenge I am facing is , under the UAT Obervation measure, I have to get “Defects Detected in” field with only UAT defects. The value of Defect Detected In in my project is “TEST - User Acceptance Test (UAT)” . Can someone help me how to write the measure formula which will display UAT defect count?
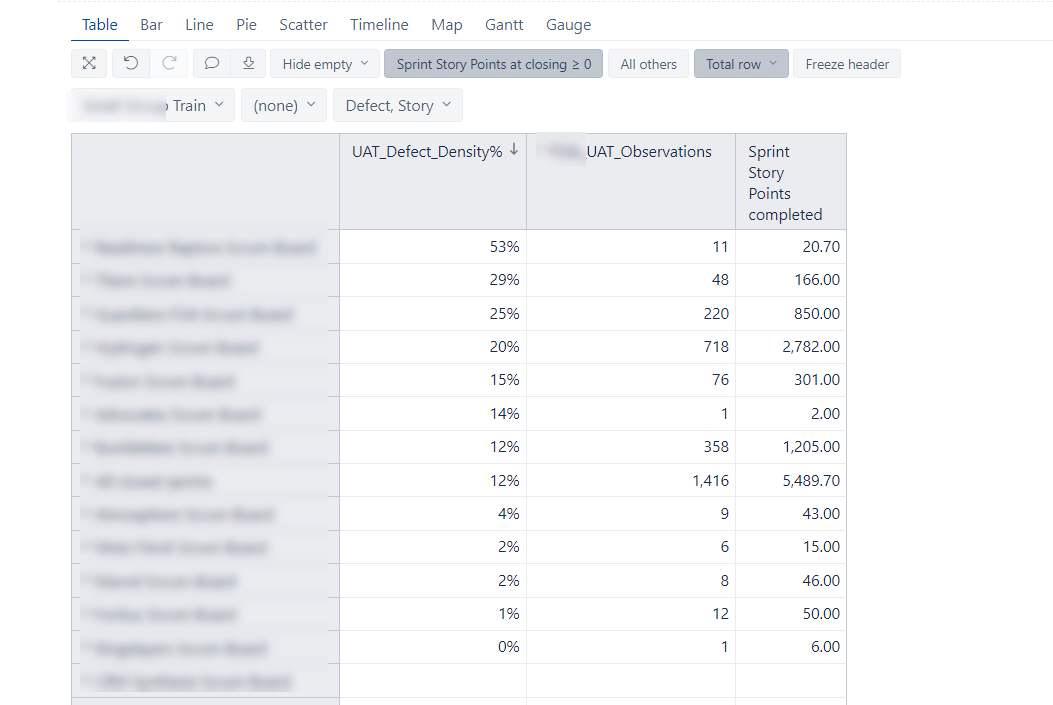
Below numbers are just indicative numbers to show what I would like to see and these are not accurat e numbers.
@subintraj
You could make sure that “Defects Detected in” field is imported as dimension
https://docs.eazybi.com/eazybijira/data-import/jira-issues-import#JiraIssuesImport-JiraCustomFields
Then create new user-defined calculated measures using tuples.
(
[Defects Detected In].[UAT],
[Measures].[Sprint issues completed]
)
OR
(
[Defects Detected In].[UAT],
[Measures].[Sprint issues at closing]
)
Both examples expect that there is value “UAT” in the field “Defects Deteced In” field for Jira issue screen.
Martins / eazyBI
2 Likes