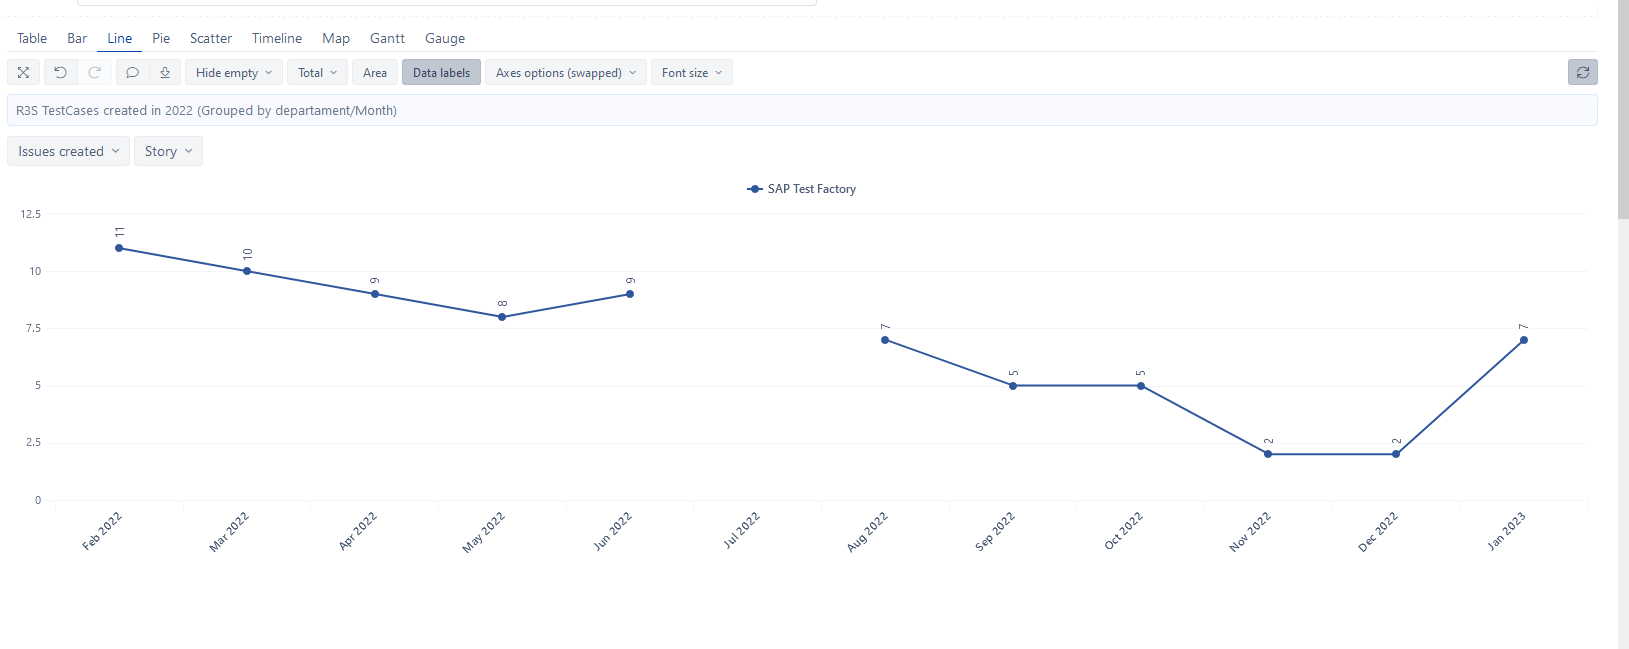
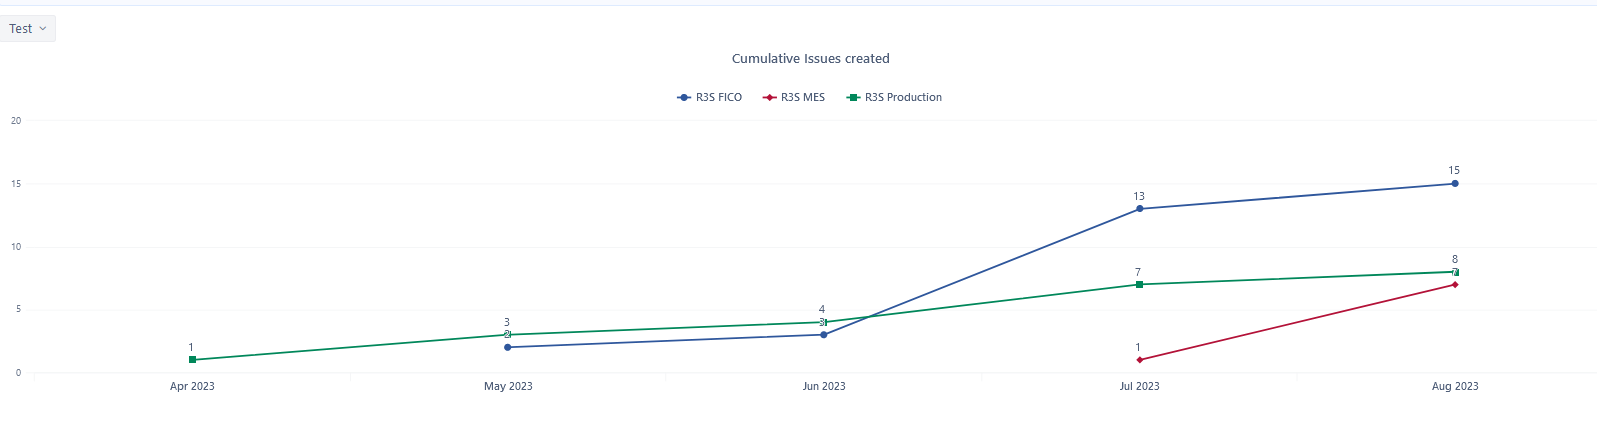
I have a line graph as you can see. I would like it to show values accumulative in every month. So the numbers on the line graphs will grow every month
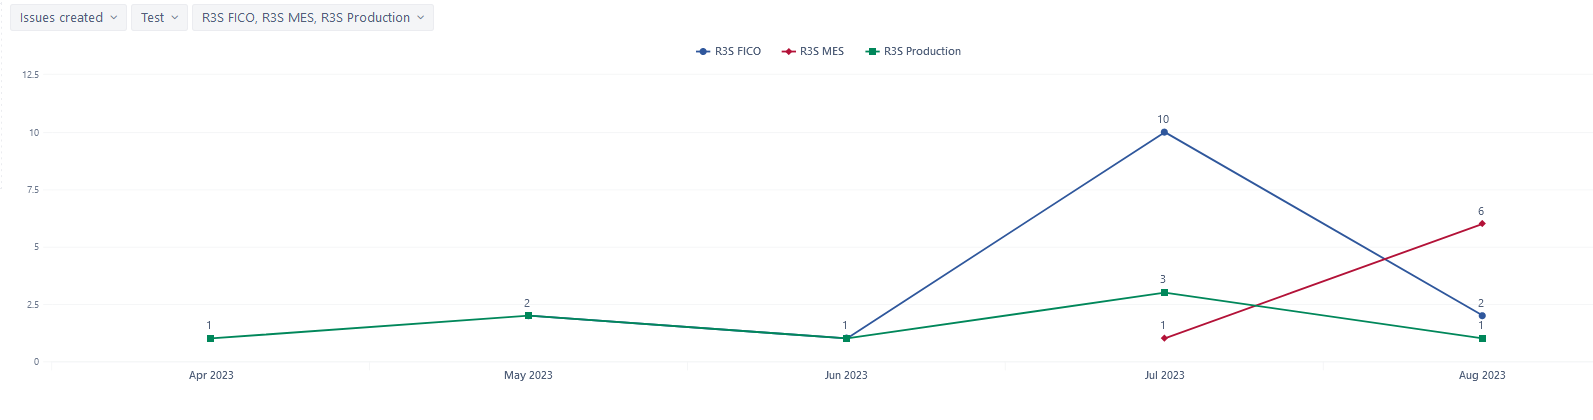
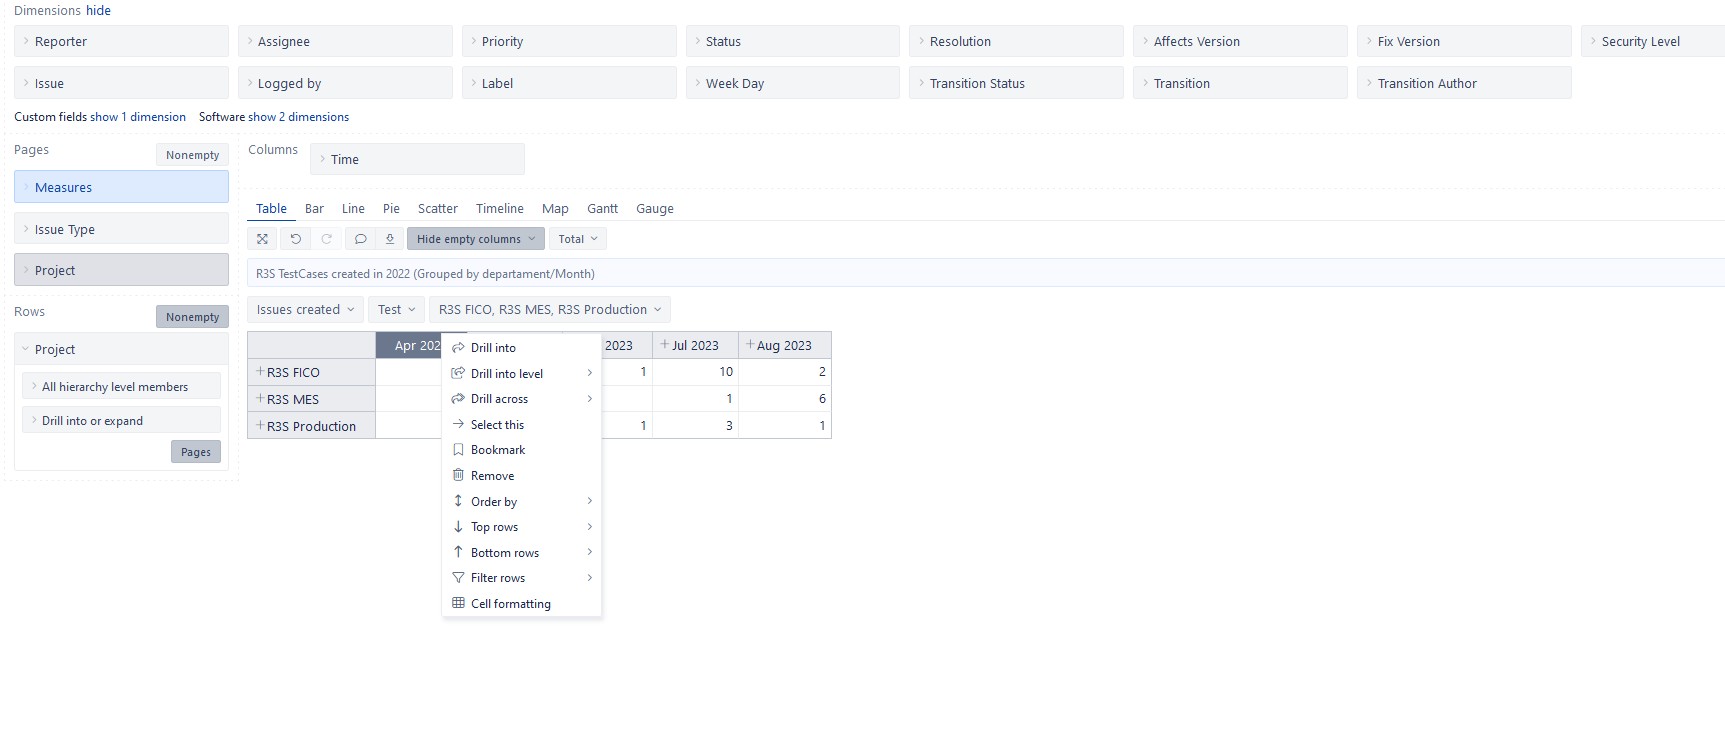
However I have a little bit more complex case now. I wish to show Line graph with cummulative values but for three different departaments (3 different lines on the graph)
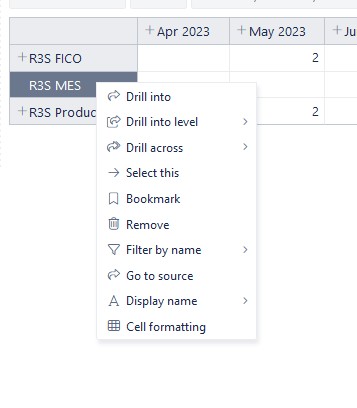
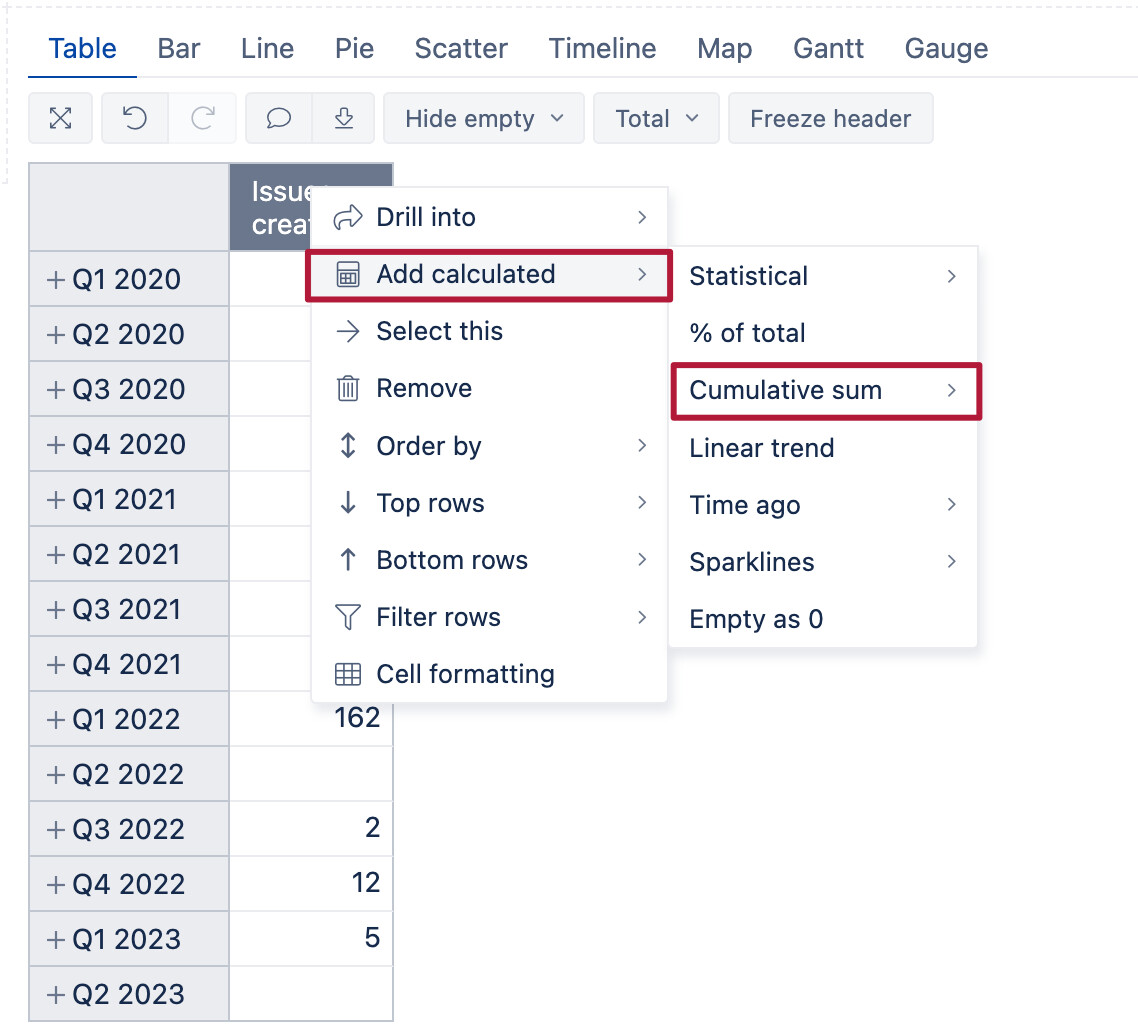
I dont see option “Add Calulated”. How I can achive it?