How to create a report containing the number of flagged issues over time

So, I want to build a report to show the progress the team is making in unflagging the issues in our backlog. Options are:

  1. Show the total count of flagged tickets per month (ideal)
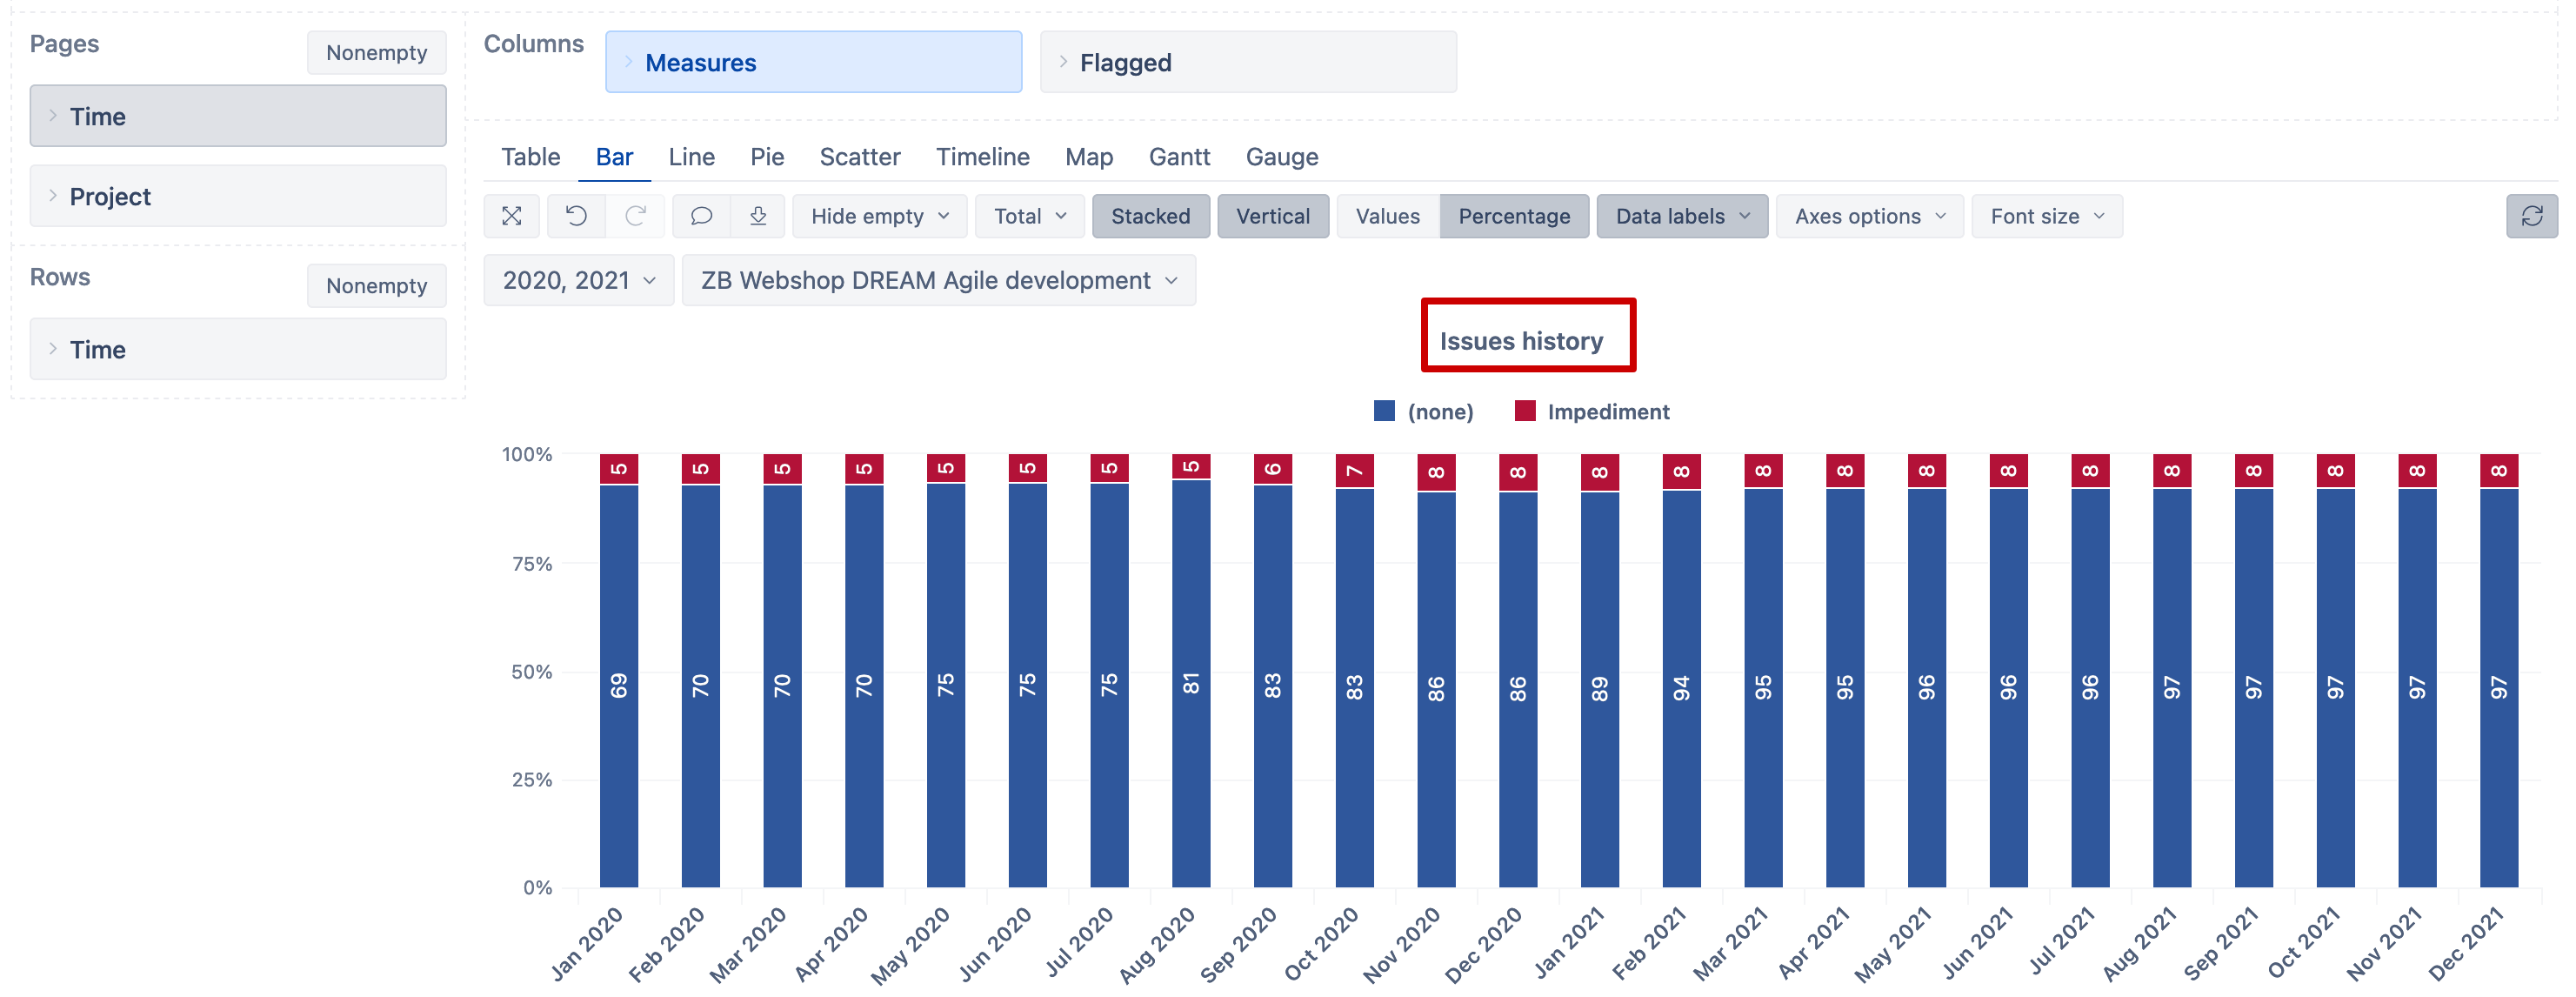
  2. Show a flagged vs unflagged count of tickets per month (similar to the usual created vs resolved dashboards)

First thing I tried was to use the “Issue flagged” measure but I think this is just to show the value for a given issue.

The closest I got so far, was to get the flagged count per month for option #2 using this calculated member:
(
[Measures].[Transitions to issues count],
[Flagged].[Impediment]
)

But then, if I use the same logic for the unflagged, I get a huge amount of records, because the tickets are created as unflagged by default. Is there a way to restrict to issues that were previously flagged before?

Is there way to build a report for option #1 ?

Thanks!

Hi @pgordalina,

You can see the count of flagged and not flagged issues over time using the measure “Issues history”.

  1. Make sure to import value changes for field “Flagged” so it would work with historical measures.

  2. In the report, set the “Time” dimension on report rows and measure “Issue history” on columns".
    More details on historical measures are described in the documentation: Import issue change history.

  3. Set dimension “Flagged” also on columns to see issue count by not flagged and flagged as impediments.

  4. You can switch to the bar chart to represent the proportion of flagged and not flagged issues. You can choose to sow absolute values with issue count or percentage in the graph (see the picture below)

Best,
Zane / support@eazyBI.com

Hi Zane this was really helpful, thanks!