Hello,
I need to create a dashboard that shows all of the issues that do have start and end date and the count of days from the start date to the end date for each issue.
Appreciate your help
Hello,
I need to create a dashboard that shows all of the issues that do have start and end date and the count of days from the start date to the end date for each issue.
Appreciate your help
Hello,
Welcome to the eazyBI community!
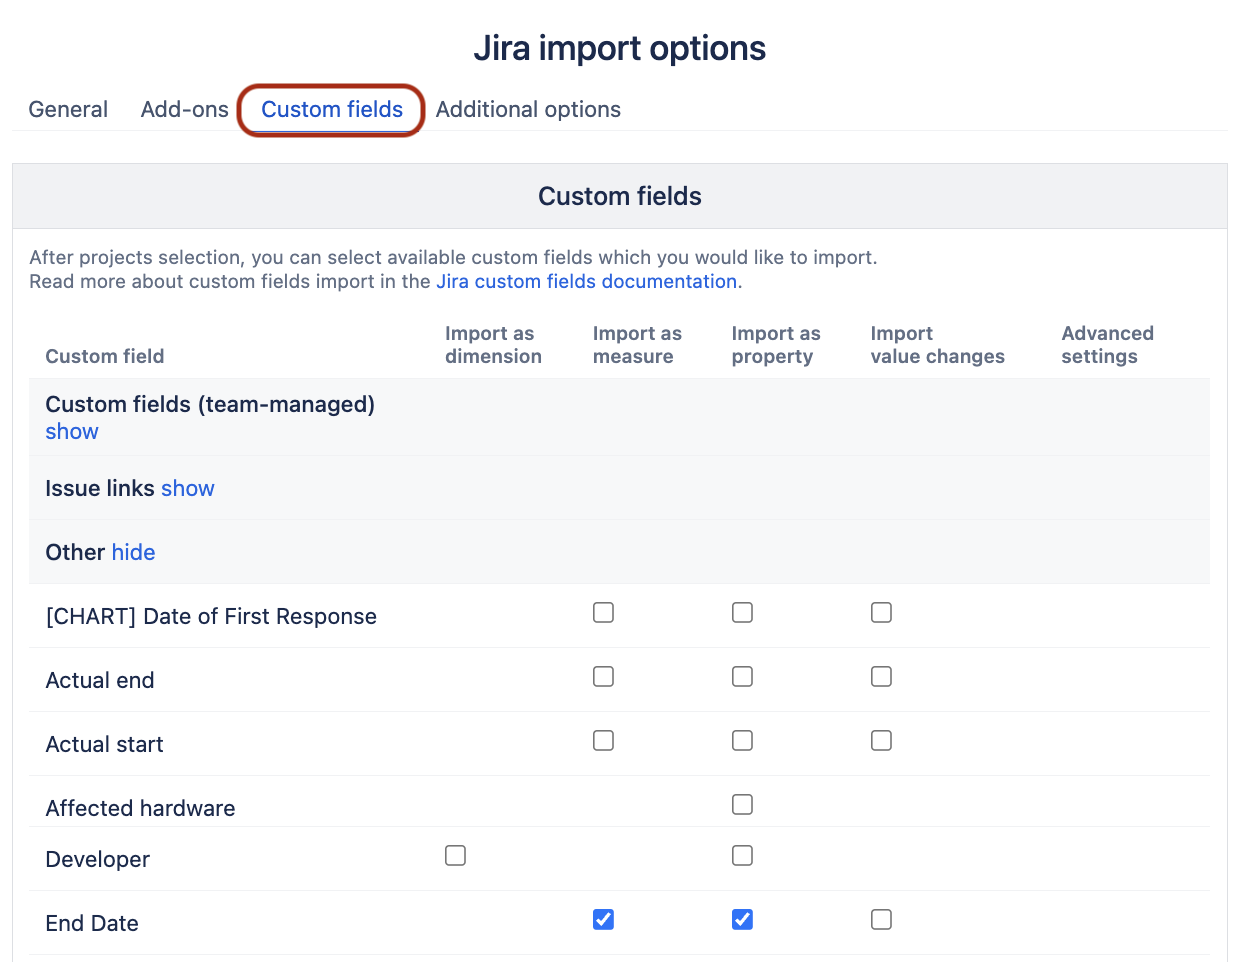
(1) First, check that “Start date” and “End date” custom fields are being imported, and if not, add them to import under the “Custom fields” section.
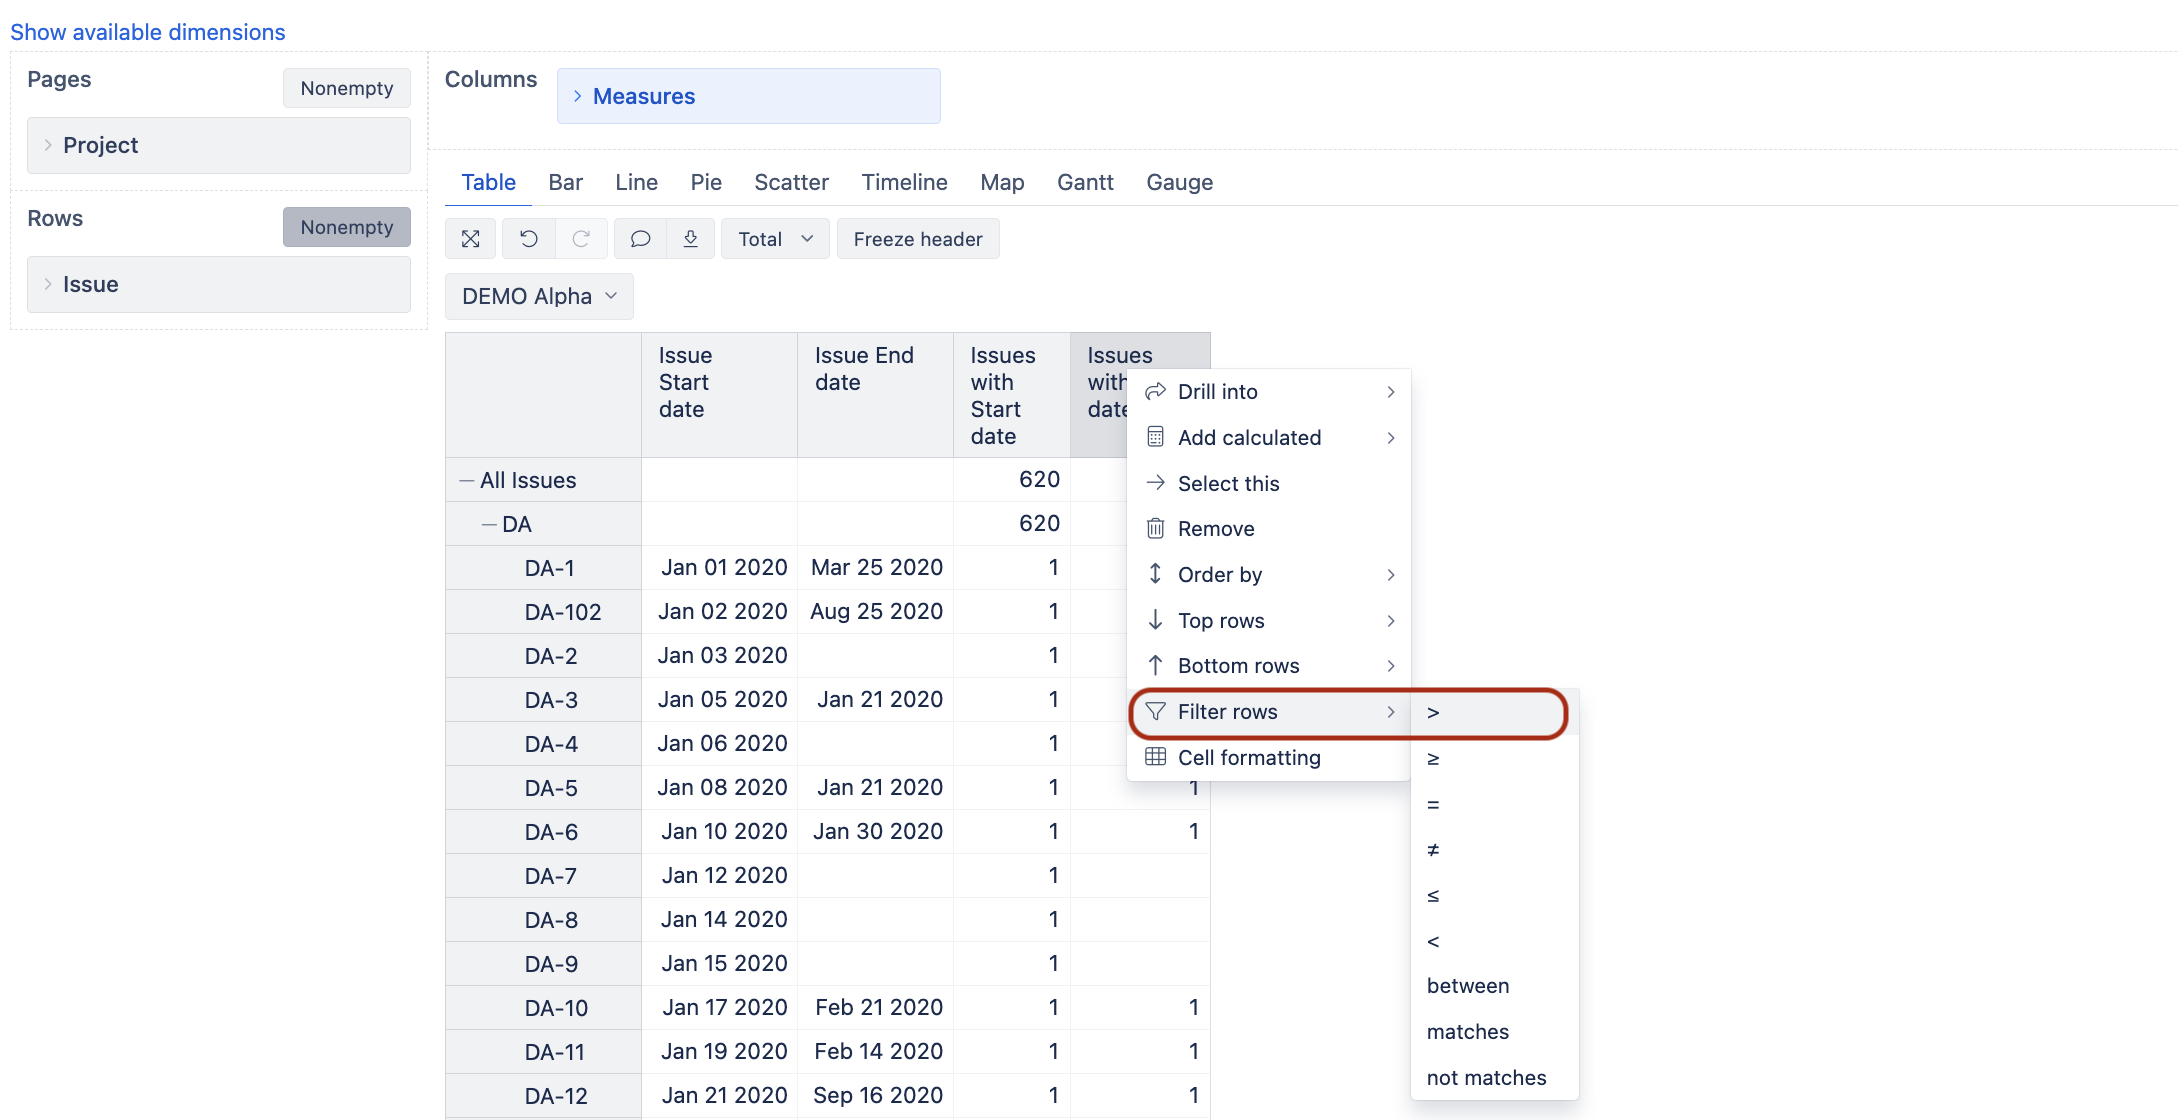
(2) Create a report with Issue dimension in rows and include the following measures and properties: [Issue Start date], [Issue End date], [Issues with Start date], [Issues with End date].
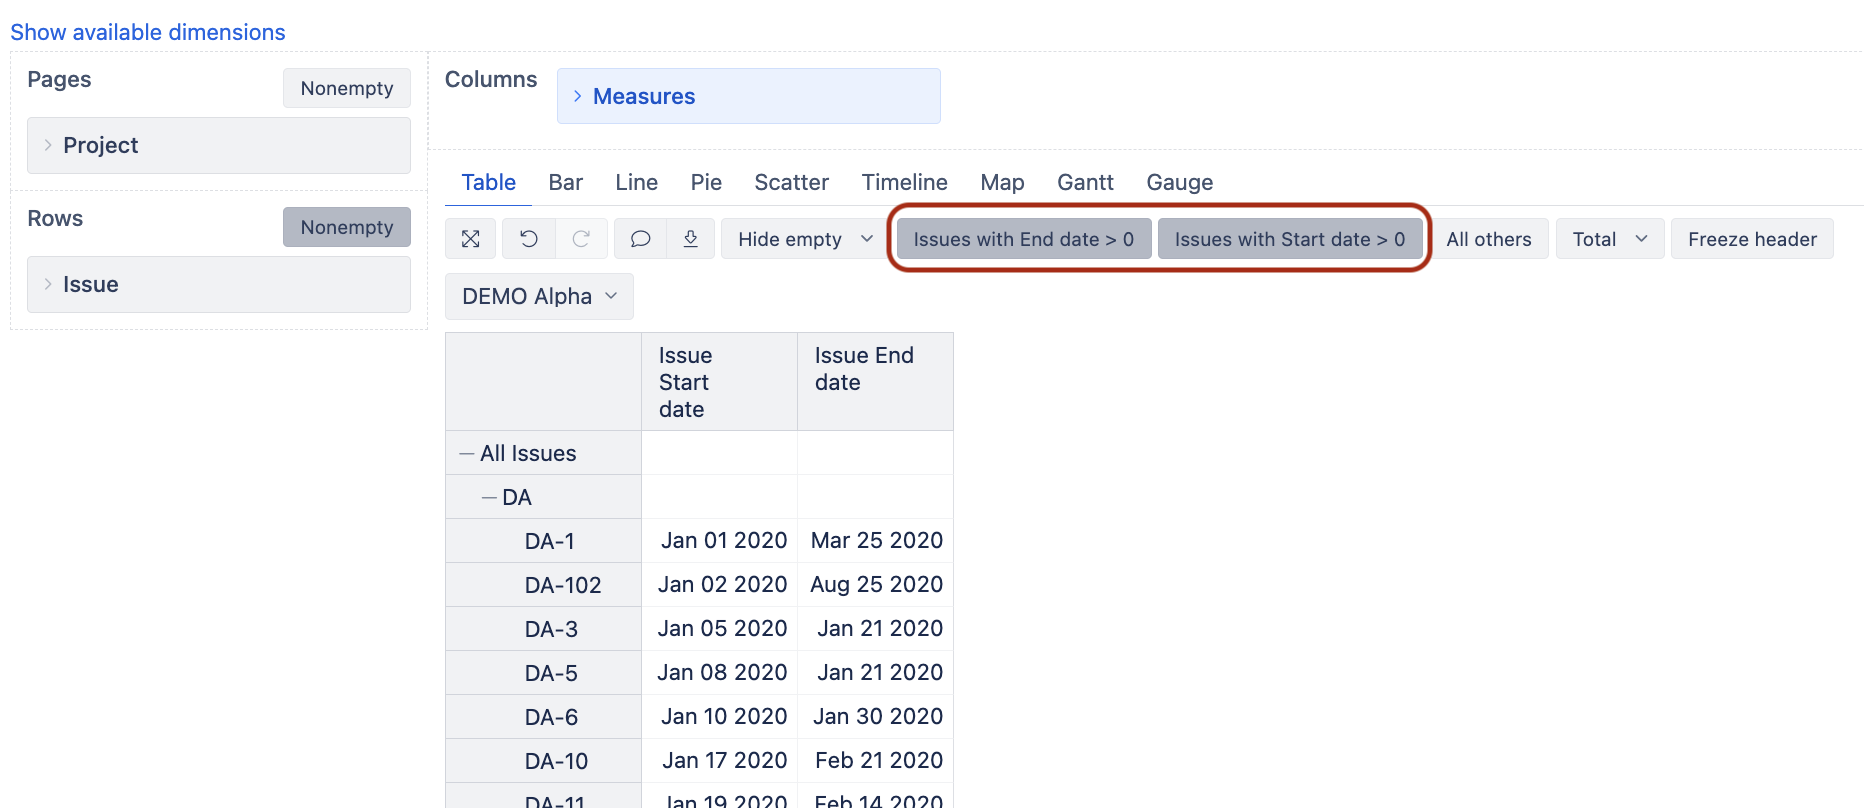
(3) Create two filters: [Issues with Start date] > 0 and also [Issues with End date]>0.
After that, you can remove those columns, but the filters will stay.
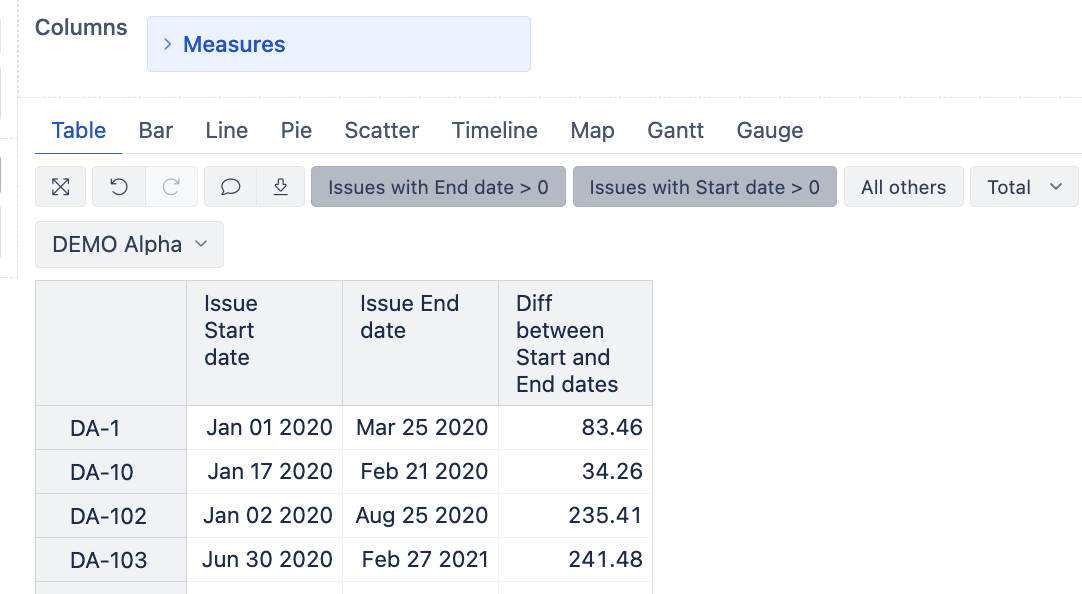
(4) Add new report-specific calculated measure with the formula:
DateDiffDays([Measures].[Issue Start date]
,[Measures].[Issue End date])
Let me know if that works for you or if further guidance is needed.
Kindly,
Ilze
Hello,
Thank you so much for help!
When I do that, instead of numbers in Diff between start and end dates I get: mmmm dd yyyy
Do you know how to fix that?
Thank you
Hi,
You need to change the formatting of the calculation from Default to Integer or Decimal.
Best,
Ilze
Works like a charm, Thank you so much!! ![]()