Hi @AmeBah ,
You can make this report using eazyBI standard functionality.
A1) First, import the custom field “Team” as a dimension, so you can use it on report rows. You should see this field in the eazyBI import options, tab Custom fields: Jira custom fields
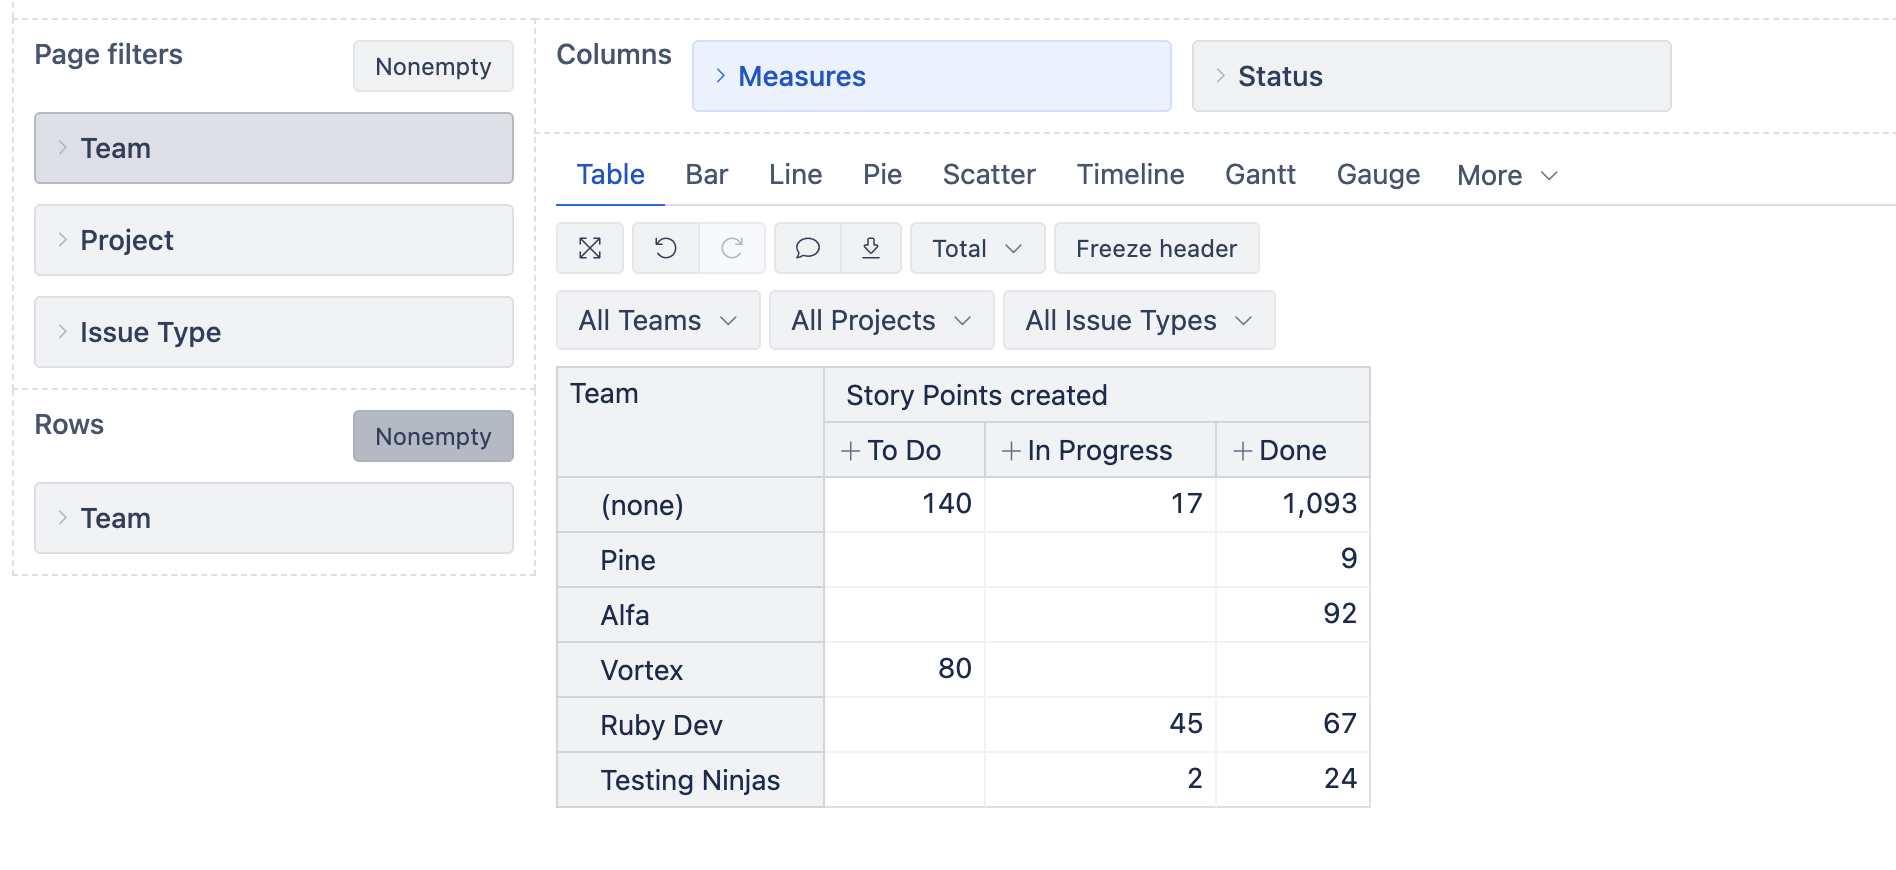
A2) On report columns, select measure “Story Points created” and “Status” dimension to group them by current status.
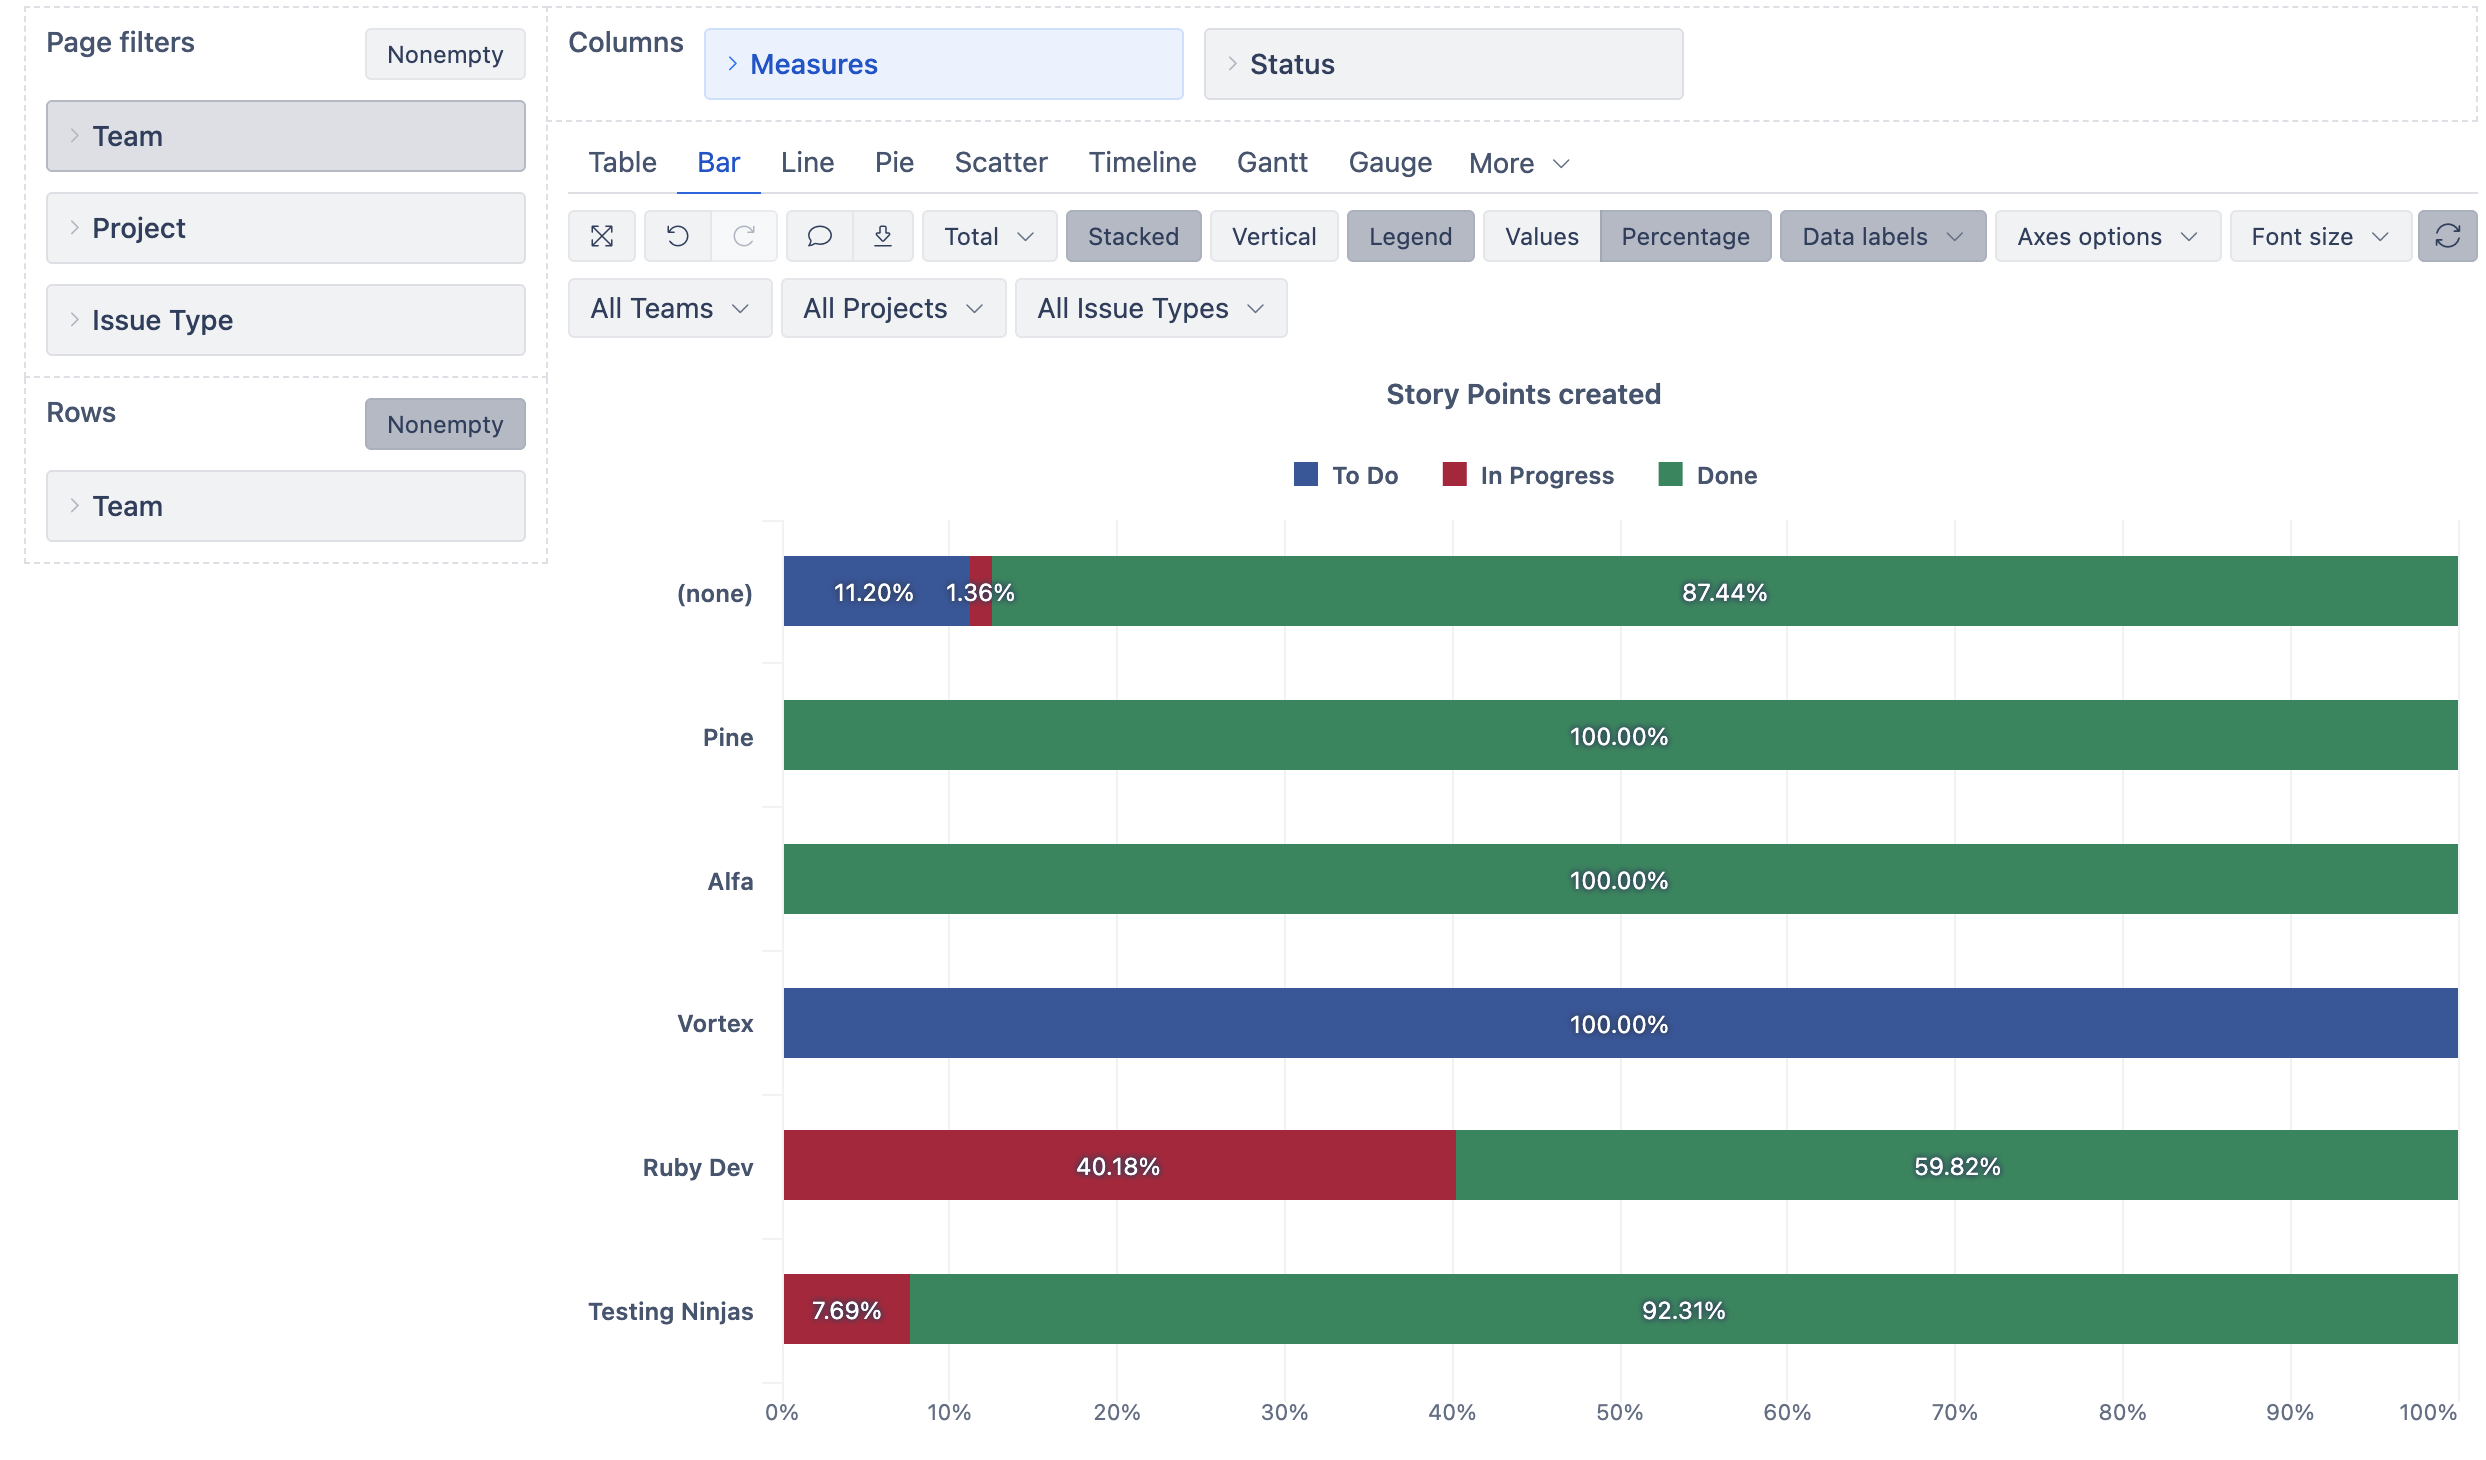
A3) Now you can switch to the Bar chart to represent Story point distribution and progress (in %) for each team. Choose to show results as stacked bars and represent them as a percentage. You can also choose to show values or % as data labels.
I like this data representation method, because it is visually clearer, and you don’t need to do any further calculations for progress.
But if you want to stick with the Table report and make a claculted measure, then this is how you should proceed.
B1) Set “Team” dimension on report rows.
B2) On columns, select measure “Story Points created”. Do not add the “Status” dimension yet.
B3) Create a calculated measure to represent the progress %. In the calcautino, use a CASE WHEN/THEN expression to avoid division by zero.
CASE WHEN --to avoid division by zero
  [Measures].[Story Points created] > 0
THEN
  --story point in any Done status
  ([Measures].[Story Points created],
  [Status.Category].[Done])
  /
  --total story points across all statuses
  ([Measures].[Story Points created],
  [Status].CurrentHierarchy.DefaultMember)
END
Set emsaure formatting to Percentage %. More details on calculated measures and CASE expressions are described in the documentation: Calculated measures
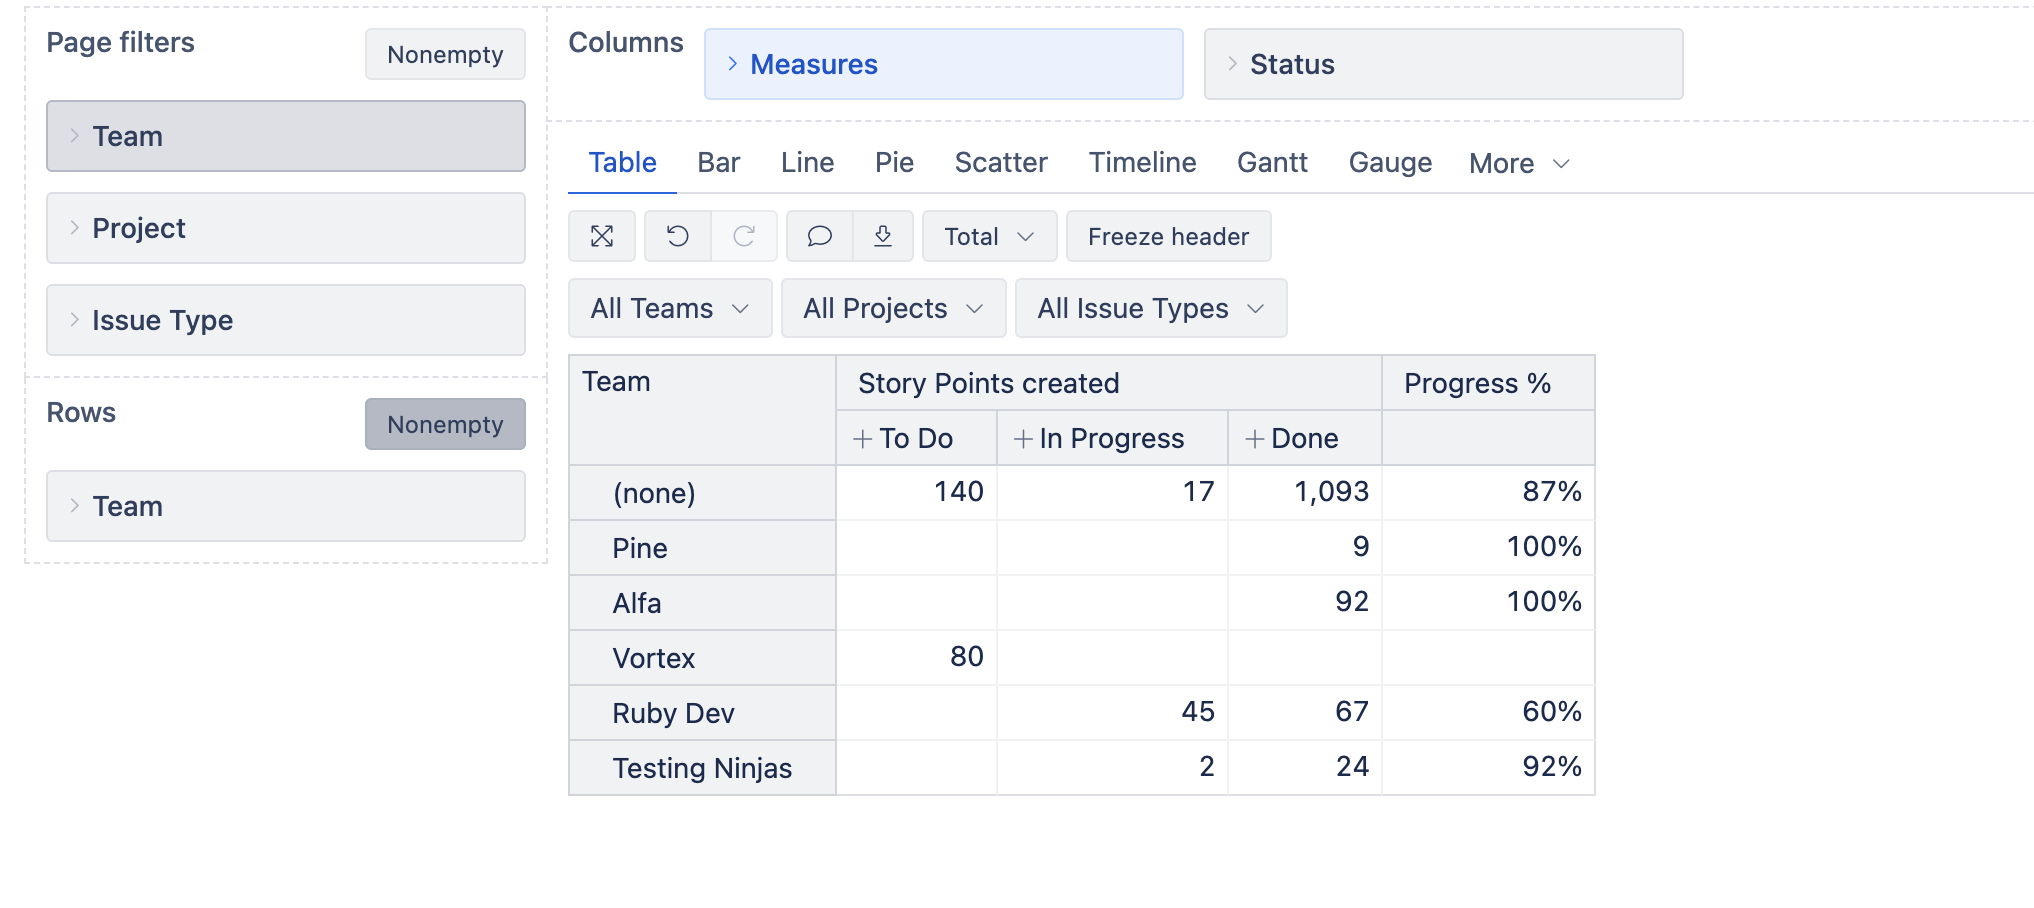
Add the new measure to the report.
B4) In the report, click on the “Story Points created” header and choose to drill into → Status → Status by category. This way you will split only one measure by individual statuses while calculation for the percentage remains untouched. More details in the documentation: Create reports .
Best,
Zane / support@eazyBI.com