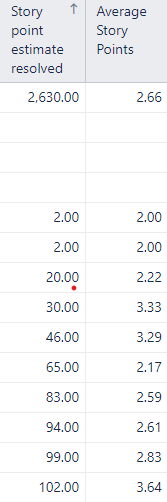
Hello, the screenshot below is a table for individual velocities showing the overall total points for each person. However, I would like to show the average velocity metric for each member instead. Can anyone assist with this issue please?

Hi @choim09,
You might want to create a new calculated measure to calculate the velocity for each report row.
The logic for calculation could be to divide resolved story points with the resolved issue count having story points estimate. eazyBI generates a wide variety of metrics for each numeric field, like Story points estimate, and some of those metrics are hidden but could be used for calculations (see the documentation for more details: Jira custom fields). In your case, you might want to use hidden measure “Issues with Story points estimated resolved”.
The expression might look like this:
[Measures].[Story point estimate resolved]/
/[Measures].[Issues with Story point estimate resolved]
More details on calculated measures are here: Calculated measures
Best,
Zane / support@eazyBI.com
Thank you @zane.baranovska for this response! Is there a way to do it on the current graph shown below instead of creating a graph for each sprints?
These are the current dimensions:
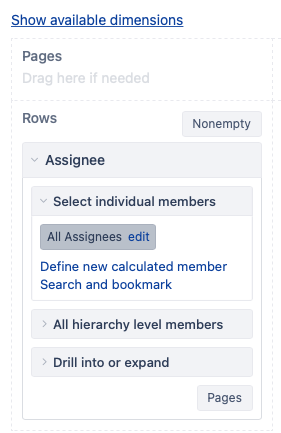
However, after adding the code in your comment for a new calculated field it does not print anything. I would like the average velocity story points to show on the graph for each assignee instead of the total.

Thank you in advance for your help!
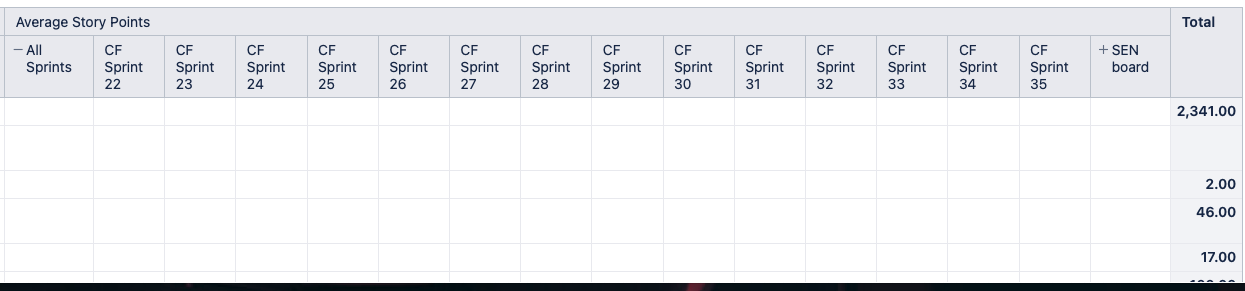
Yes; you can show the “Average story points” in one column and “Story points estimate resolved” split by sprints.
-
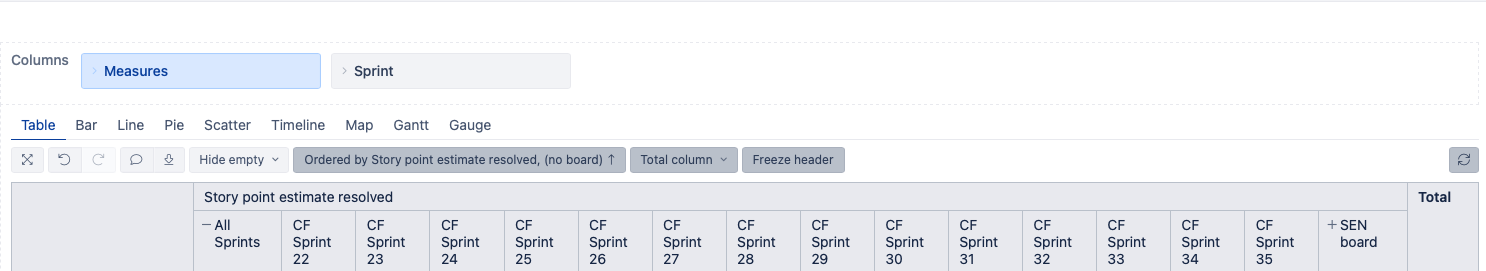
Remove the “Sprint” dimension from the columns. Do not worry, we will add it back.
-
Add measure for Average velocity to report columns and remove the Total. At this point, you should have only three columns: Assignee, “Stry points estimate resolved” and “Average story points”.
-
Now you can drill into the measure “Stry points estimate resolved” by another dimension, in your case Sprint. To do this: click on column “Stry points estimate resolved” header and chose option Drill into → Agile → Sprint.
See the documentation for more details: Create reports - Drill into measure by another dimension level. -
Now you can open the Sprint dimension and adjust which Boards or Sprints you would like to see in the report.
Did you use autocomplete in the formula editor to validate the formula? Looks like the formula had a typo; I just updated it in the post above.
Best,
Zane / support@eazyBI.com
Hi @zane.baranovska,
Thank you for this information. However, for step 3, I do not see the option to drill into sprint. Please see screen shot below.
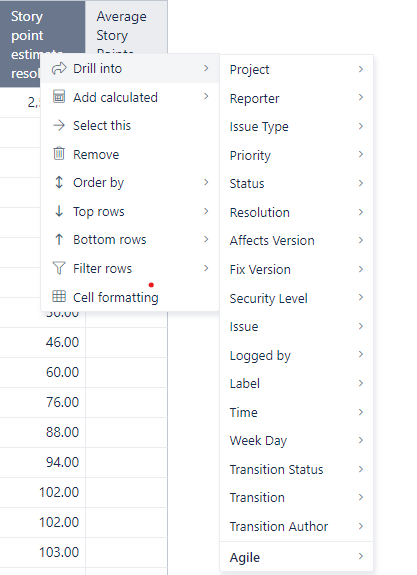
Ine azyBI dimensions are grouped by the application or app the same way as you see them in Analyse screen when building reports. The Sprint dimension is in the “Agile” group.
click on column “Stry points estimate resolved” header and chose option Drill into → Agile (group) → Sprint (dimension).
Hi @zane.baranovska, Thank you - that seemed to work. However, I think the specified calculated measure may not be the correct one. It doesn’t seem to calculate the average story point estimate. Is there a measure to divide story point estimated resolved over total assigned story point estimates?