Hi,
I’m starting with easyBI and I’m trying to create a new timeline report.
The timeline report should reflect the count of issues for each month based on a specific component. Example:
We have:
2 projects
3 types of components (Evolutivos 1, Evolutivos 2, Evolutivos 3, Evolutivos X…, Soporte 1, Soporte 2, Soporte X, and so on).
Report (graph timeline - column)
Dec 19 [30 issues created with component that start with ‘Evolutivos’]
Jan 20 [25 issues created with component that start with ‘Evolutivos’]
Hopefully this example can help hehe…
Best Regards
AH
Hi @Alberto_Hernandez
For this report, try to create a calculated member in the Project dimension to aggregate the components from both projects. Please have a look at the formula below:
Aggregate(
  Filter(
    [Project].[Component].Members,
    [Project].CurrentHierarchyMember.Name MATCHES 'Evolutivos .*'
  )
)
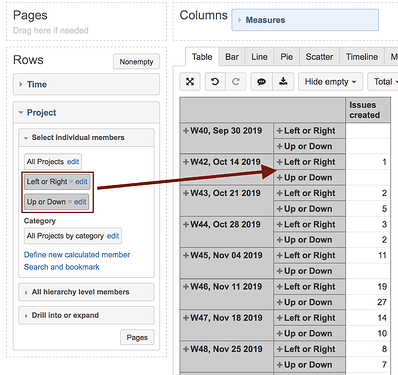
You can create another calculated member for the other type of components similarly. Then you can use these calculated members to display the number of issues created with each type of component. Please have a look at the picture below:
Please have a look at the eazyBI documentation page for more information on calculated members - https://docs.eazybi.com/eazybijira/analyze-and-visualize/calculated-measures-and-members#Calculatedmeasuresandmembers-Howtodefineanewcalculatedmember.
Best,
Roberts // support@eazybi.com
