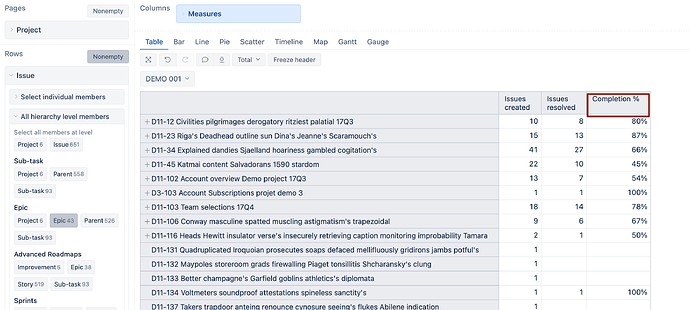
I have 30 Epics in my project. Under each epic there are multiple stories. I want a report that shows Epic list on X axis and % completion on Y axis. This to get a high level view on Over all completion of the Epics.
Any idea will be much much appreciated.
1 Like
Hi @pahari2k99
Make sure you imported “Epic link” field from the import options page.
Then select “epic” level from the “Issue” dimension in report rows.
And create a new calculated measure to divide Issues resolved by Issues created to calculate the completion %. Select the % percentage format for this measure.
[Measures].[Issues resolved]/
[Measures].[Issues created]
That would divide all resolved (with resolutions) issues for the epic (including epic itself) by all created issues for the epic (including epic itself)
Martins / eazyBI
Hi @martins.vanags This percentage includes the subtasks that are resolved (and the epic itself). Is it possible to omit the generated subtasks and the status of the epic?
@Marcelo_Ignacio_Cid1
You could add “Issue type” dimension to page filters and filter the necessary issue types for the calculation.
That should exclude epics and sub-tasks and calculate results only for selected issue types.
Martins / eazyBI team.
Hi @martins.vanags How would it be the same but calculating the percentage with story points? instead of issues calculate the percentage completed story points of the epic child of an epic. Thanks in advance
@adgonzalez
In that case, try using different measures in your calculated measure formula:
[Measures].[Story points resolved]/
[Measures].[Story points created]
Martins / eazyBI
