Hi ,
i am new to easyBI i am trying to generate the defect leakage report / chart using easyBI
please help me on this
Hi ,
i am new to easyBI i am trying to generate the defect leakage report / chart using easyBI
please help me on this
Hi @Shyam_Emmadi,
To give you a precise answer, more information is necessary. Usually, defect leakage is defined by dividing the number of defects found by end-users by the number of defects found in QA. How are both of these metrics defined in your environment? Separate issue types, statuses, projects?
An example as a calculated measure with separate issue types could look similar to the one below:
CASE WHEN  ([Issue Type].[Defect],[Measures].[Issues created]) > 0
THEN
  ([Issue Type].[Bug],[Measures].[Issues created])
  /
  ([Issue Type].[Defect],[Measures].[Issues created])
END
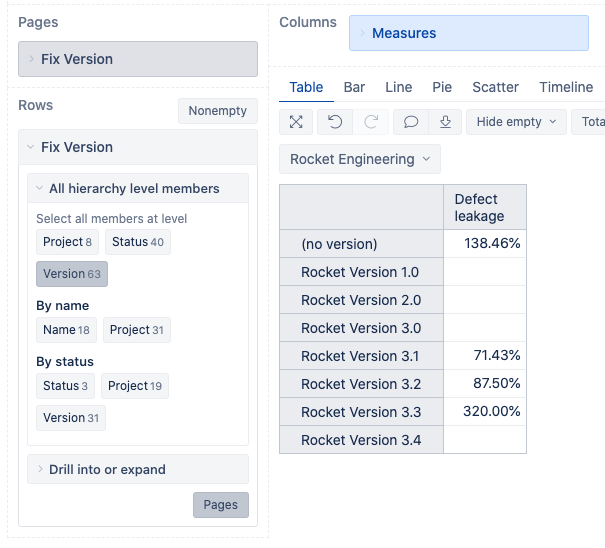
Where defects found by end-users are registered as Bugs, but defects found in QA registered as Defects. Please have a look at an example below where you can see the leakage across several Fix Versions:
See the eazyBI documentation for more information on defining calculated measures - https://docs.eazybi.com/eazybijira/analyze-and-visualize/calculated-measures-and-members.
Best,
Roberts // support@eazybi.com