Note that “Status” dimension returns the current status of an issue even if “Time” dimension would be used in the report. Therefore measure “Open issues” may not give you expected results when “Status” dimension is filtered.
To display a number of issues in historical statuses over time, we recommend importing issue change history (via eazyBI import settings).
That will create some new dimensions and measures in your eazyBI JIRA issues cube.
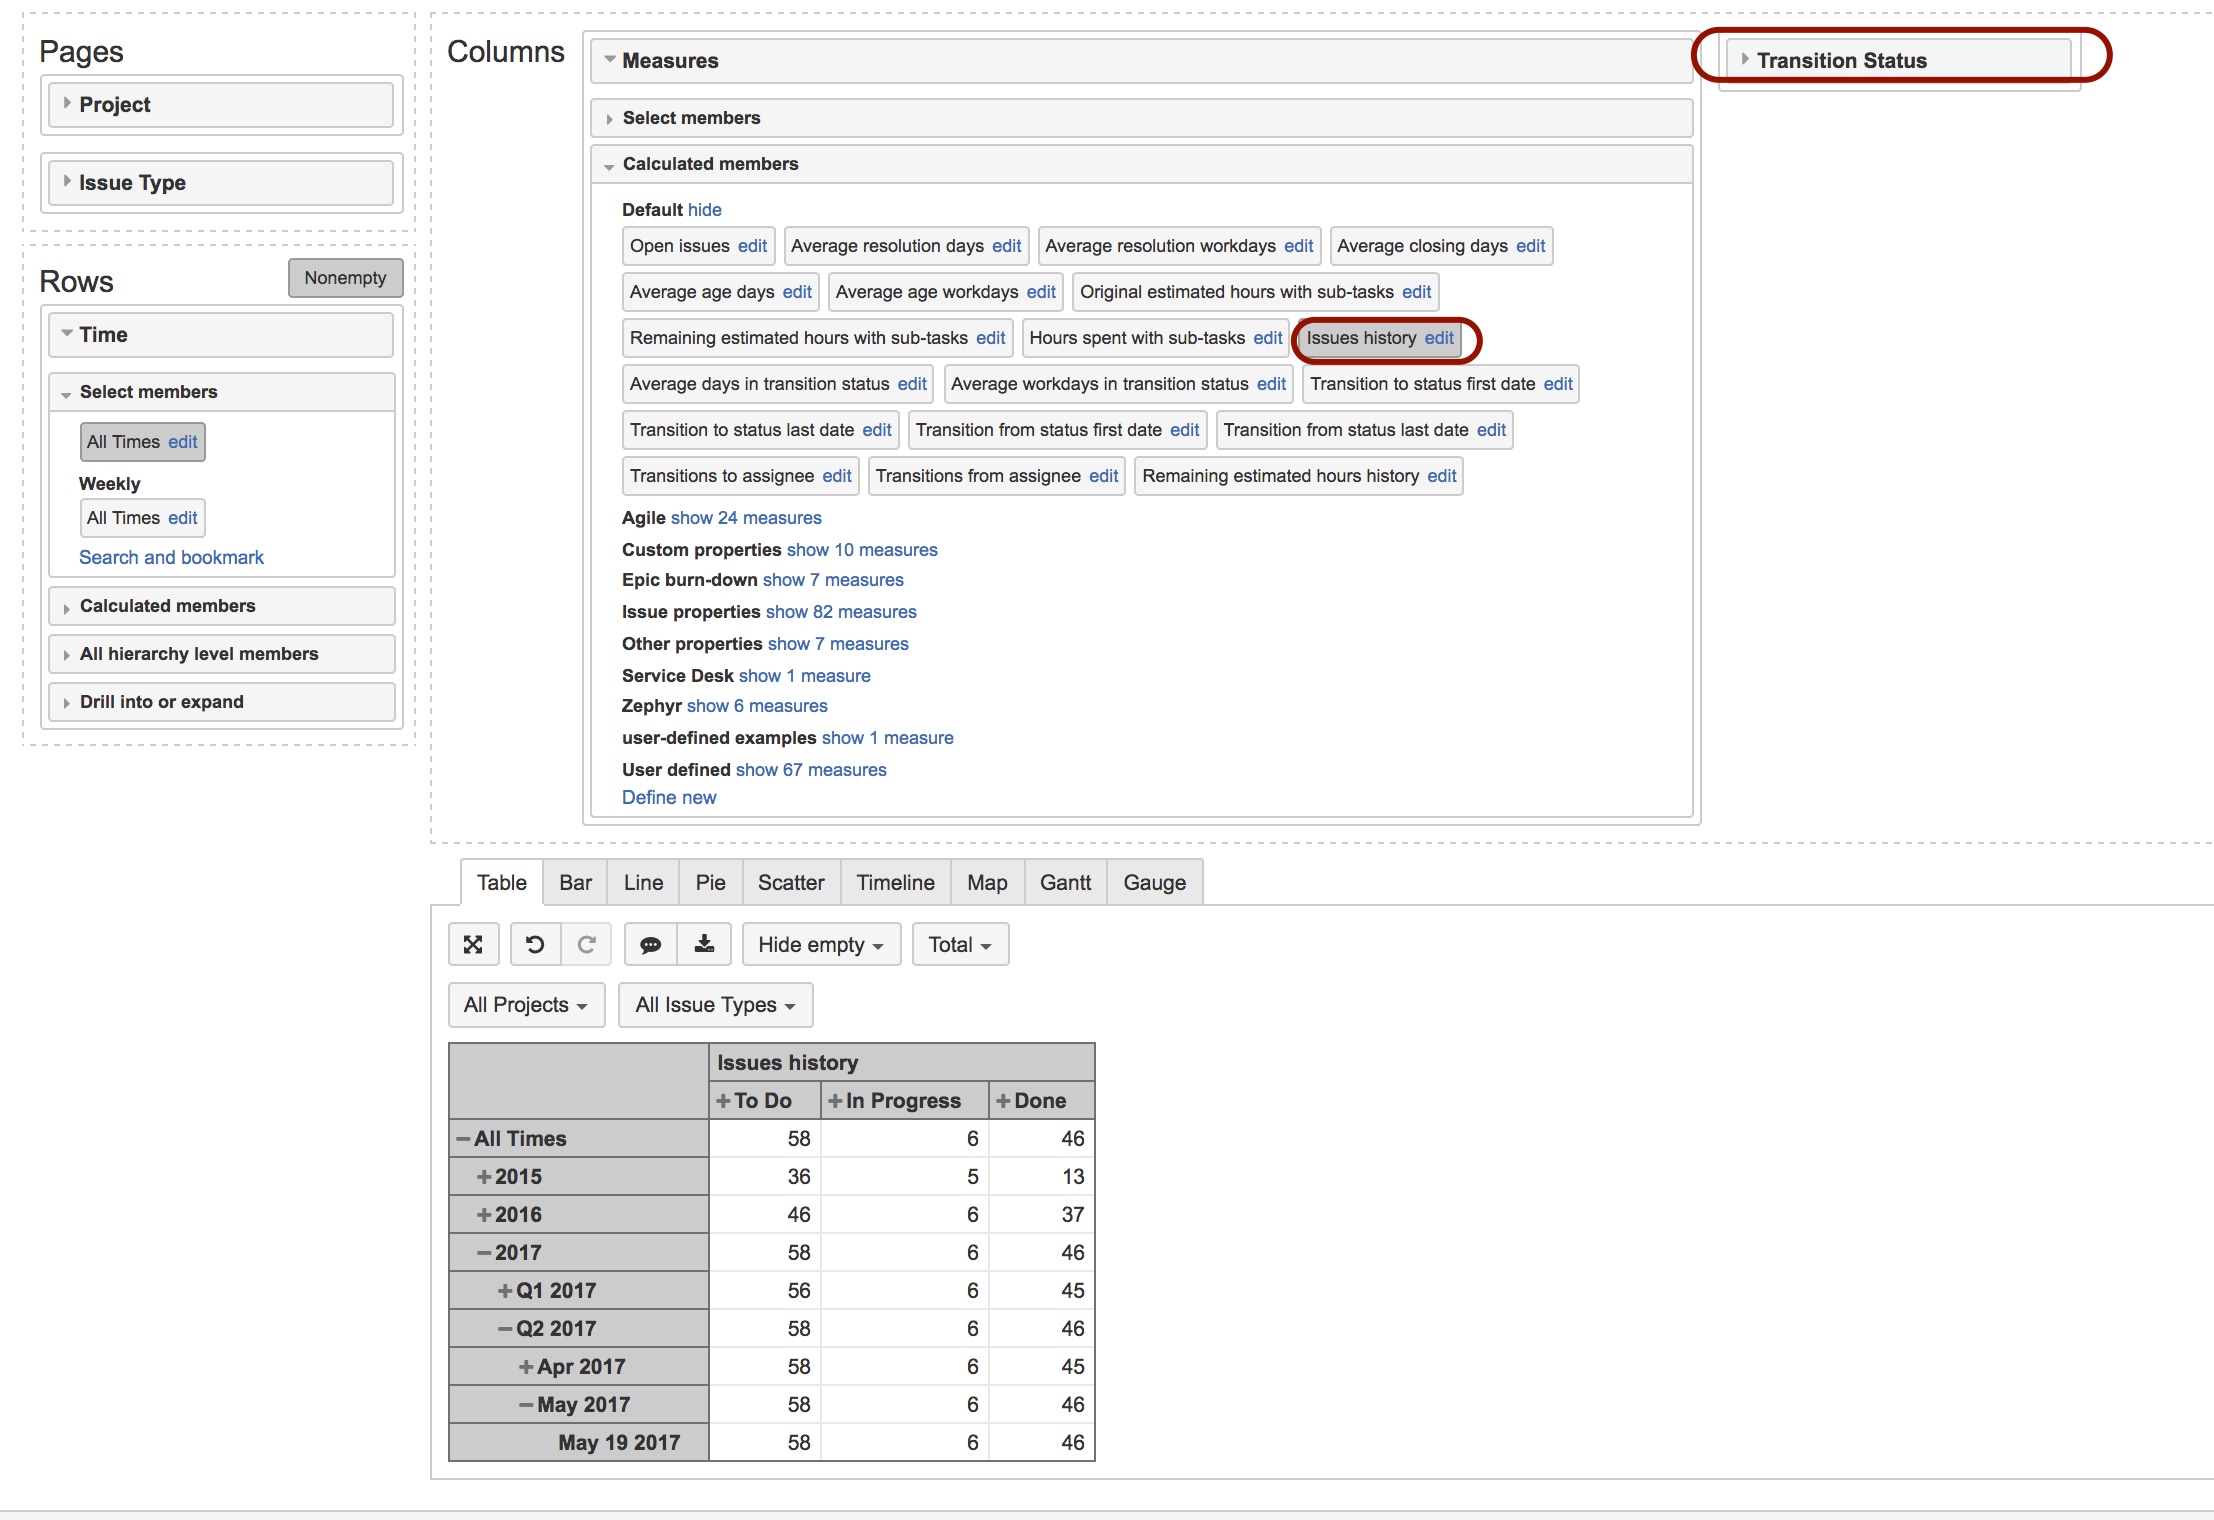
Next, you could use measure “Issues history” together with “Time” dimension and filter your report by “Transition Status” values.
how can I display the transition status of linked members depending on the actual issue? The actual issue have issue type “A” and the linked member issue type “B” because of different Projects.
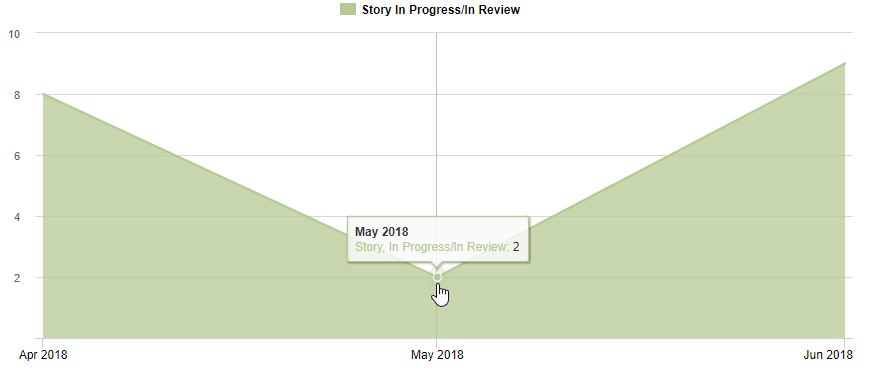
But I try to get the count per month. When I just select “Month” as time hierarchy level, it looks pretty wrong, it shows me just 2 WIP items for May Seems like he chooses the count of the last day of the month?:
You are right with your asumption. Measures with sufix history would display the count of the last day of the month.
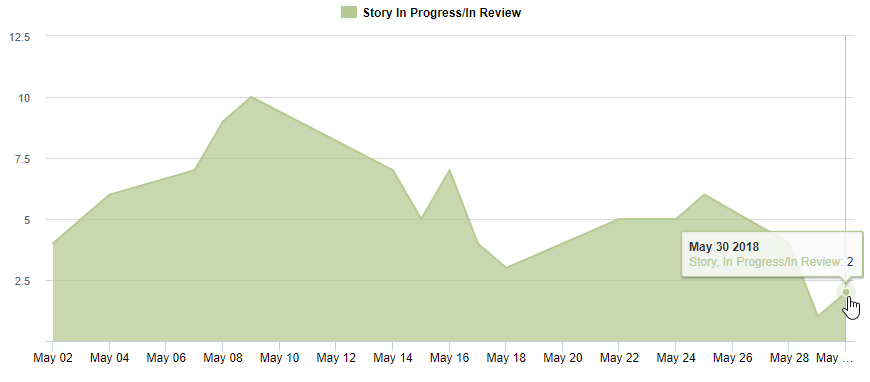
I believe you should create a new calculated measure that would return the average number of issues history for displayed month and calculate it from all days from the month.
Try this code:
Just need to check the benefit or use case of this report “[How to display number of issues in historical statuses over time?]”.What exactly User can abstract from this report.
You could follow the development of issues in a particular status over a time.
To understand what is the average number of issues in “In progress” status month by month (week by week).
How else would you know how many issues there was in “In Progress” status two months ago?
You can still use the measure “Issues history” with “Assignee” dimension members and filter the report by the “Time” dimension.
If you select Jan 10, this would calculate the number of issues for the assignee at the end of Jan 10 (11:59pm)
I see some cunt issue with history.
Ex: #of the assigned status issue on 10th Jan 2021 is 30
When I click drill through issues I can see 33 records received and lost column having -1 and 1 this is causing the count issue i guss.
Can we eliminate -1 from the count so that count will come correct i guss.
please reach out to support and provide more details including exported report definition
Issues history should not return negative values unless the context for the report is built wrongly or there is something wrong with the changes coming from Jira changelog.
How can I specify this to the transition status of In Progress? It won’t accept it if I change [measures].[transitions to status] to [measures].[transitions to status],[transition status].[in progress]
I would like it to count/identify the issues that were moved to the In Progress status each month. Then how could I also include those that remained in the In Progress status each month?
Next, you could use measure “Issues history” together with “Time” dimension and filter your report by “Transition Status” values.
Hi @martins.vanags,
I don’t understand what is the difference between combining “Issues History”, “Time”, “transition Status” and combining “Issues History”, “Time”, “Status”.
I can see that the results are different, but I don’t know why.
The “Status” dimension would always group issues by their current status today, however “Transition status” would look at historical status in the report.
You notice the difference only when start using “Time” dimension, because one dimension would group issues based on their current status, which can change for the issue over time.
Thank you so much for the explanation.
Does that mean that combining ‘Time’, ‘Issue History’ and ‘Resolution’, the issues would also be grouped by the current Resolution today?
If it’s the case, is there a equivalent of ‘Transition Status’ for resolution?
@Marilou
Resolution is one of the few dimensions eazyBI automatically ipmorts change history about.
The Resolution would play along with “Time” dimension and group issues by historical resolution.
 ,
,
 Seems like he chooses the count of the last day of the month?: